SimRod experience: From Belgian blocks to vehicle durability testing (part 2)

Test schedule creation
Okay, referring to my previous blog post, couple of weeks later I’d like to continue with my vehicle durability testing campaign. Vehicle is fully instrumented, instrumentation is checked and approved. So, now you can go to the proving ground and start driving. Good plan, but how are you going to drive? On which track or road profile, at which speed, how many times, under which loading conditions, … ?
All this is defined by the test schedule. This schedule basically gives you an overview of all the tests to be performed in order to cover the different load scenarios, or customer usage scenarios, as you wish. With this schedule, you are going to check if your vehicle is durable enough for the selected customer or region.
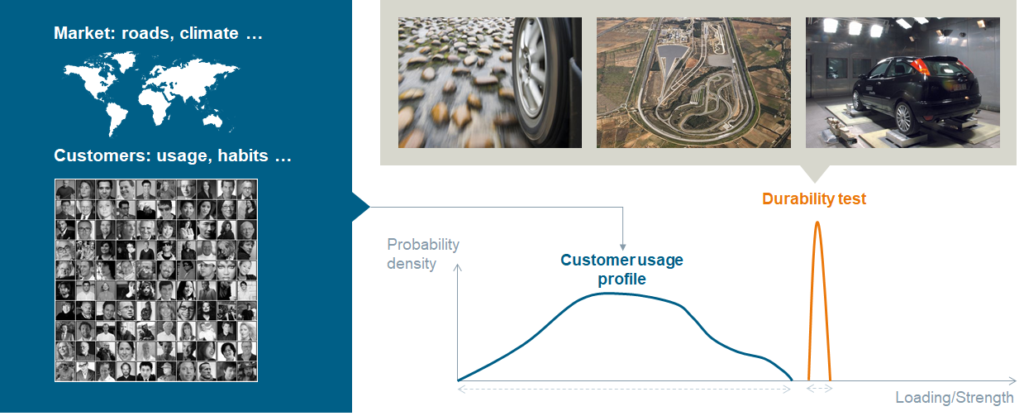
Typically, this test schedule is defined by a so-called ‘customer correlation’ project. The goal of such a project is to get a realistic idea of how exactly your customers will use your vehicle. Or more specifically, how much damage will be caused on your vehicle by the intended usage. You understand, there can be a big difference in driving style and frequency: think of the “grandma-style” vs. taxi driver. But also, there is a difference in road conditions (e.g. German highways vs. Indian public roads). That is why, for such customer correlation projects, extensive fleet measurements are conducted in that specific market. During these measurements, multiple vehicles are driven on local public roads by real customers over a longer period of time.

The outcome of this process is a customer usage profile. In this profile, the different measured fatigue loading on your vehicle are plotted against the probability density. This probability density represents how many customers cause a specific load on your product.
This profile can then be used to correlate/link the customer usage – or the respective total damage – to the tracks of an existing proving ground, or to the damage caused by these tracks. Using a clever algorithm in one of the many processing capabilities of the Simcenter Testlab Neo software, you get a nice schedule of how many times you need to run over each of the existing tracks on the proving ground, in order to cause the same damage as when being driven by your customer in his specific region. So, when your vehicle survives these tests on the proving ground, you are sure that your vehicle will also withstand the worst driver case for your selected region or market and will not break before its anticipated life time.
Since we didn’t perform such a customer correlation project for our SimRod (typically this takes several months or even more than a year), and the proving ground we were going to use had a limited number of rough road elements, we created our own test schedule based on experience and good sense.
Doing the miles
The durability track, or rough road as they call it, of the proving ground in Aldenhoven, contained four different rough road elements: plate bumps, saw tooth profiles, Belgian blocks and rough asphalt.
Since we wanted to get high load inputs on our vehicle, we mainly drove on the Belgian block and saw tooth profile.
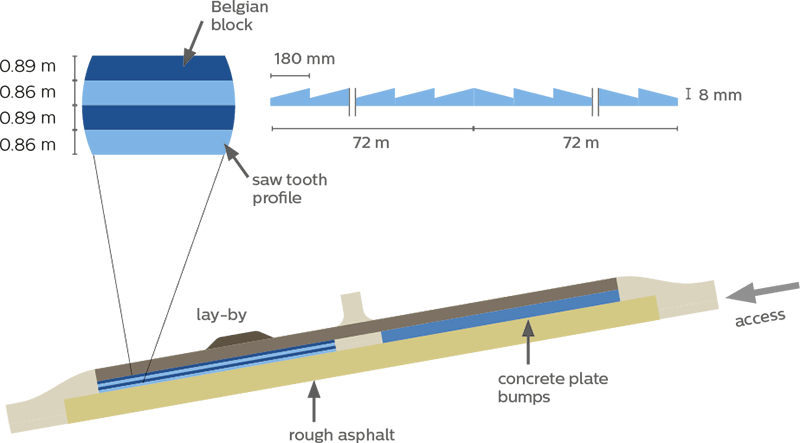

On each of these two road profile elements, we decided to drive at two different speeds: 30 km/h and 50 km/h. We also tried to drive at 70 km/h, but believe me, driving in an open car, with a pretty hard suspension, on Belgian blocks, at a speed higher than 50 km/h is really scary! So, my co-pilot and I decided to remove this test from our to-do list.
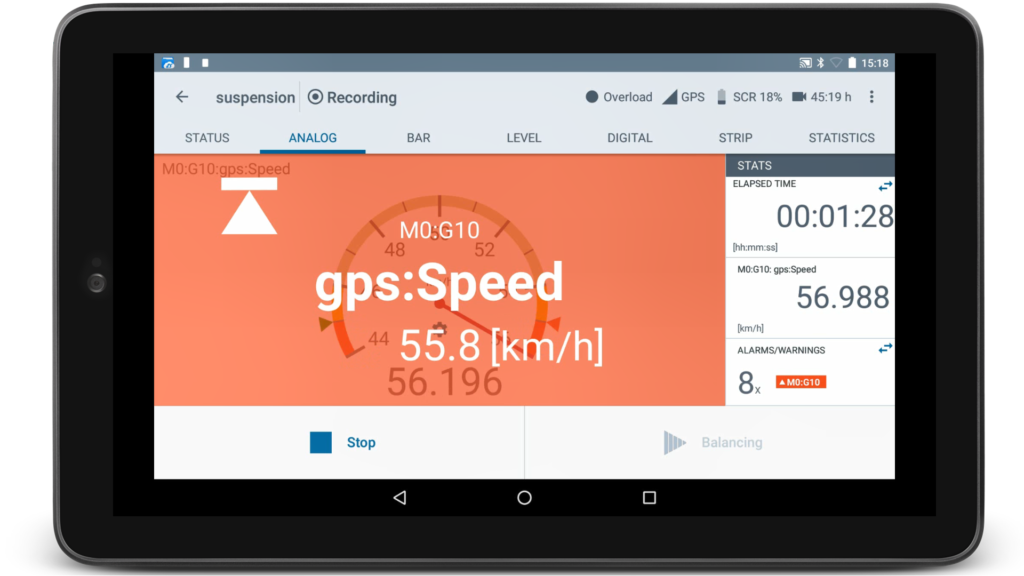
In order to avoid redoing some of the measurements because something went wrong, it is important that the driver is informed in real-time about the status of the sensors, acquisition system and test procedure.
Thanks to the live alarms in the Simcenter Testlab Control app, we were immediately informed during the measurement, if specific sensors showed some strange behavior or exceeded pre-defined limits. We had set, e. g. limits on the actual speed of the vehicle. By doing so, we were informed immediately when we needed to accelerate or decelerate during each run. Other limits were set on some vital sensors, like the accelerometers on the four wheel knuckles. So, there was no need for us to wait until the run is completed and data is analyzed on the PC, to decide if the run was OK or not. That was a great time saver !
Are you using a Simcenter SCADAS RS system to do your measurements ? Please refer to one of my recent blogs to read how the embedded SCADAS RS Recorder app can simplify your track-side data validation.
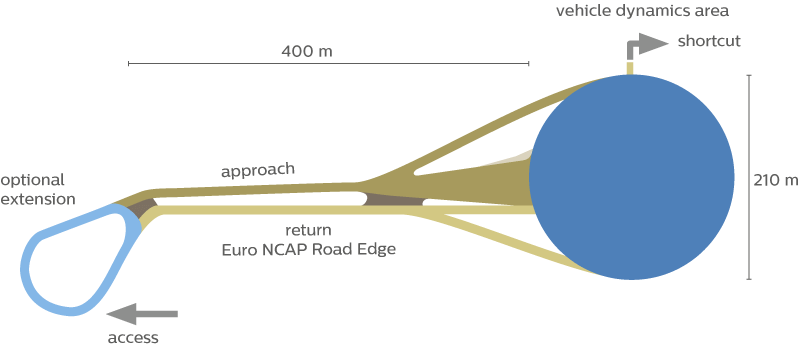
The rough road track was just besides the “main” road of the proving ground, or the oval circuit as they call it:
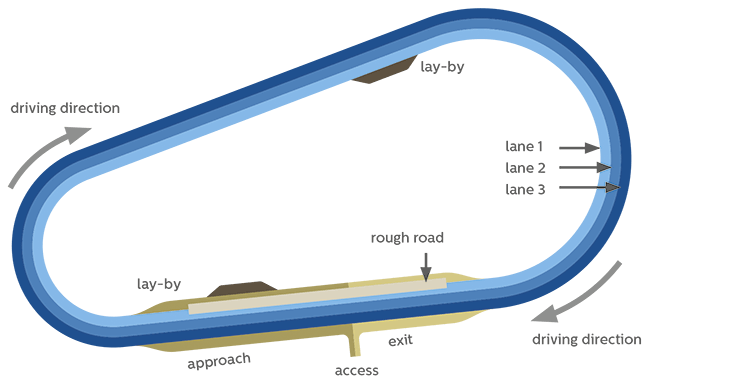
Since we were only allowed to drive in one direction, we needed to continue along the oval circuit, until we reached again the start of the rough road. To facilitate things, we sometimes kept on measuring while driving over the oval circuit. Later on, when processing the data, we can easily remove the part on the oval circuit by using the ‘GPS split‘ method in Simcenter Testlab Neo.
Besides our tests on the rough road, we also did some extra tests on other test areas of the proving ground.
On the vehicle dynamics area, we were able to do some – more extended – “figure-8” tests and a couple of “acceleration & braking” tests. Since this area was large enough, we could go from zero to the maximum speed (120 km/h), and then do an emergency break.
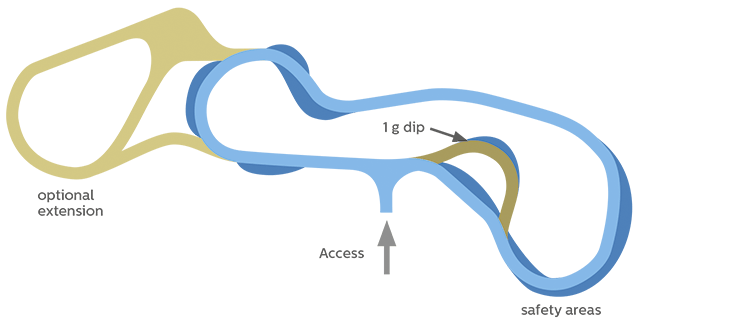
The proving ground in Aldenhoven also has a handling track. Here, we could drive a couple of laps, to test the ride and handling performance of our electric vehicle. To be honest, I was quiet surprised by it’s performance! The acceleration you feel, when pushing the “gas” pedal, and the good vehicle stability in the curves, made it actually really fun to drive !
Data validation in vehicle durability testing
After the fun, the serious work comes!
Now we need to make sure the measured data is validated. We need to be confident that this data can be used to calculate the durability performance of our vehicle.
For this, we do not only need to check the data quality, but also the test procedure quality.
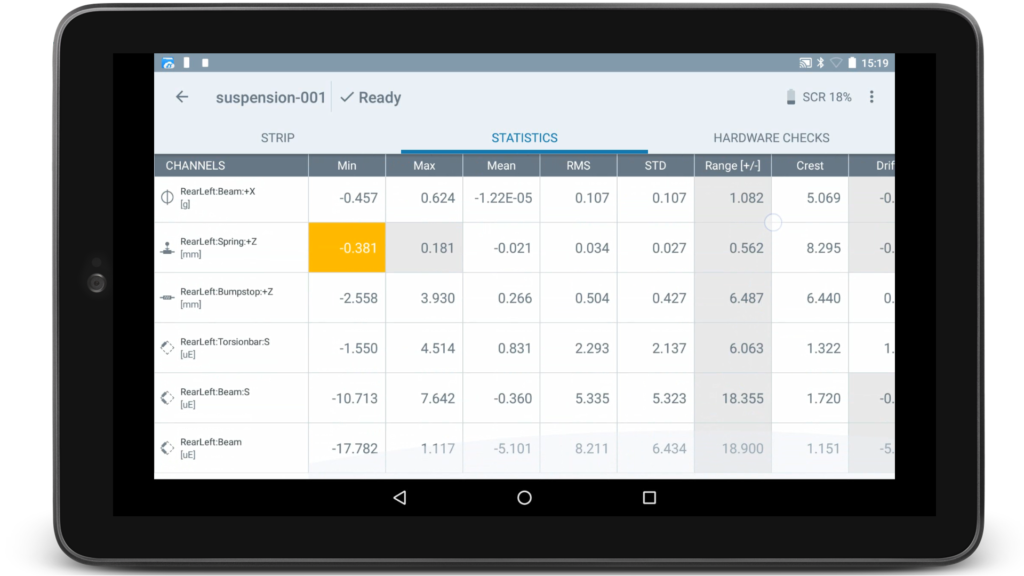
As said before, during the actual measurements, we used the Simcenter Testlab Control app to assess and verify the data quality: were all sensors working correctly? Are there no strange peaks or drifts in the data? Did we succeed to avoid flat lines? As you can see in the picture below, the Simcenter Testlab Control app online calculates different statistics for each sensor and marks the outliners with an orange (close to the limit), or red (over the limit) color.
On another tab, you can also see the hardware errors. If specific sensors experienced during the measurement some issues, such as overload, a cable got broken or disconnected, the Simcenter Testlab Control app indicates the respective sensors with an appropriate error message and coloring.
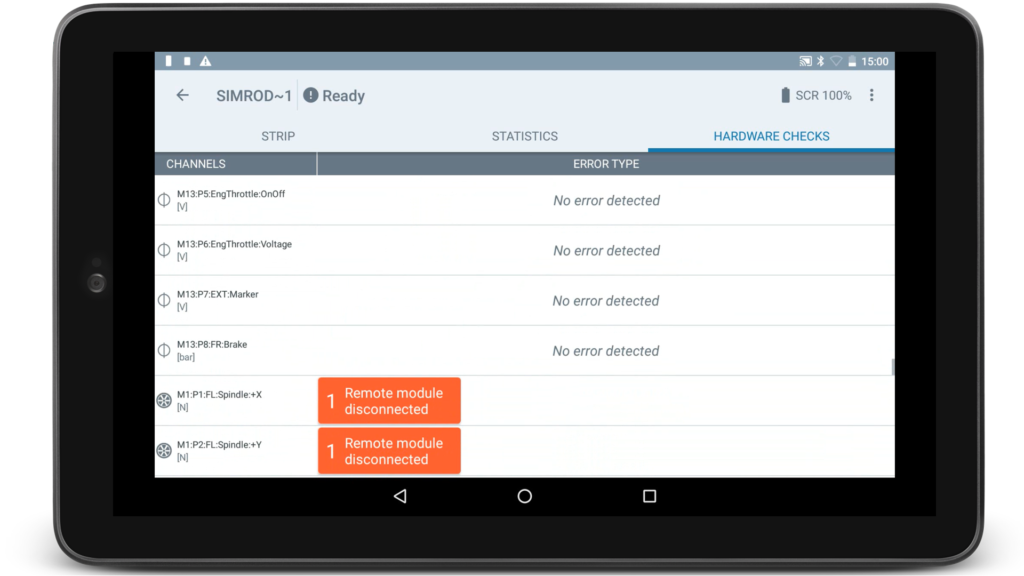
All this makes it much easier for the driver to look for potential bad sensors and decide if the measurement can be kept or not.
Please also check my blog to read how the embedded, license-free SCADAS RS Recorder app gives you all information on the spot to evaluate the measured data quality.
Next, we needed to validate which runs were within the pre-defined test conditions. These conditions are customer and test dependent, but there can be conditions like “did the driver drove on the Belgian blocks at a steady speed between 45 and 55 km/h ?”, “did the steering wheel turn three times left and three times right while driving on the vehicle dynamics area?” or “did the vehicle constantly accelerated to its max. speed and then decelerated to a full stop?”
Now, this can be a burdensome job, since in that case the test engineer needs to go through all the different runs and manually check the pre-defined test conditions one-by-one.
In the Simcenter Testlab Neo software however, we have added a couple of productivity enablers and track-side validation methods, to make the engineer’s life easier.
First of all, in Simcenter Testlab Neo, you can find the so-called ‘Pivot table’ and ‘Preview’ display. Thanks to these features, you can very easily and quickly create a compact overview of the desired measured channels after or even during the measurement.
With other competitive software, to visualize a channel, you need to manually create the correct graph and then drag & drop the desired data into the graph. When you want to visualize other channels, you need to repeat this for every channel or graph you want to see.
In the Simcenter Testlab Neo software however, you simply need to select the desired data in the ‘Pivot table’ on the left and the ‘Preview’ display on the right will automatically show the correct, corresponding graph.
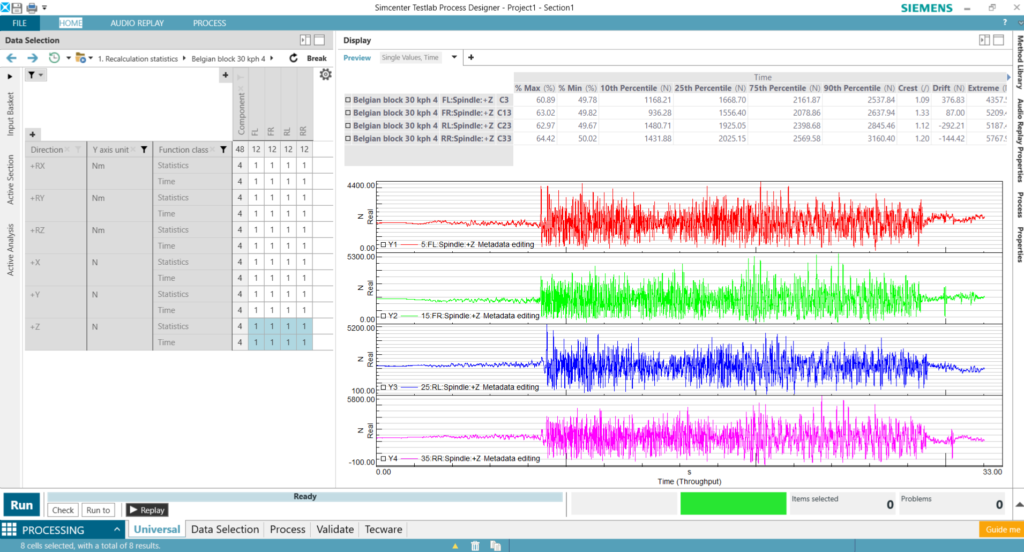
The ‘Pivot table’ also allows you to filter, or group channels based on one or multiple of their attributes, e.g. the direction or measured quantity. So, with this feature, you can create in just a few clicks a clear and condense overview in one window of all the desired channels on a vehicle.
As you can see in the picture above, selecting multiple data is also no problem. Simply select the desired cells in the pivot table, and then you can instantaneously see the respective graphs in the display pane on the right.
Another nice feature in Simcenter Testlab Neo, are the track-side validation methods, like the ‘Checks’ method. This new method drastically simplifies the data validation. In a simple user interface, you can define one or multiple conditions on the selected test data. No need for complicated calculations or writing complex code.
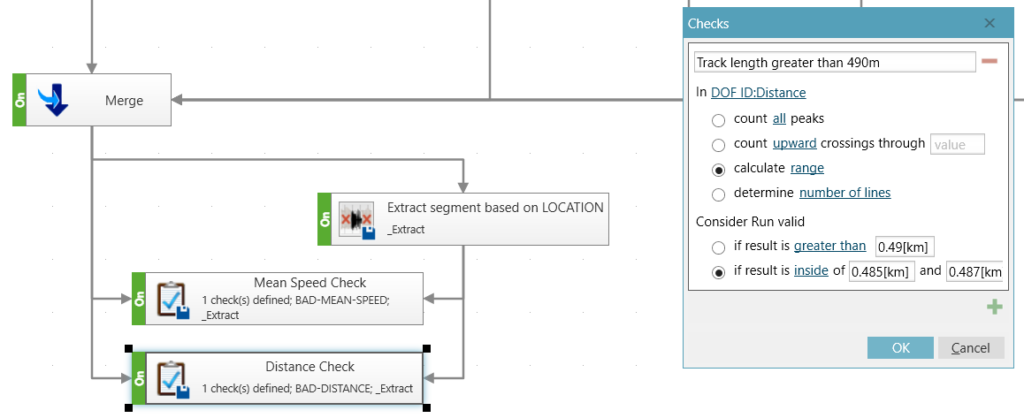
This and other methods can be embedded in an automated process, which then can be executed immediately after the measurement.
Another nice thing about processing data in Simcenter Testlab Neo is that it is a very visual operation, where you simply drag & connect methods to each other and as such create a full process.
But all this will be for my next blog !
If you missed the first part of this blog post, you can find it here.


