NVH Processing in Simcenter Testlab Neo Process Designer
Hello September, holidays are over – at least for most of us. As days are getting shorter, it seems the right time to review and sort all the holiday pictures! I personally like to manually create a photo album. But I also love the way my smartphone is automatically re-arranging them for me! It can sort them by category, by location (geo-localization!), highlighting the good shots and telling me which ones are not so great… Yes, it does remove a bit of the suspense that we used to have when opening a photographic film some decades ago:
But let’s admit it, this automation level saves time and also ensures higher quality results. We can draw a parallel to how NVH data is acquired and analyzed. Are you manually processing and validating your test data, channel by channel and run by run? With datasets getting always bigger, it is comfortable to automate things. It would even be better if, just like my smartphone, my processing software could tell me what is good and what should be ignored. Good news, Testlab Neo Process designer can help you get the best out of your data quickly and efficiently. Let’s have a look!
Setting the scene: instrumentation done right
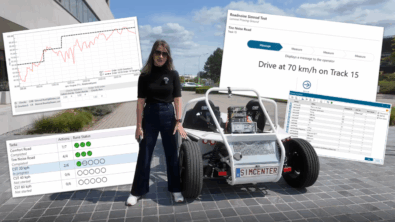
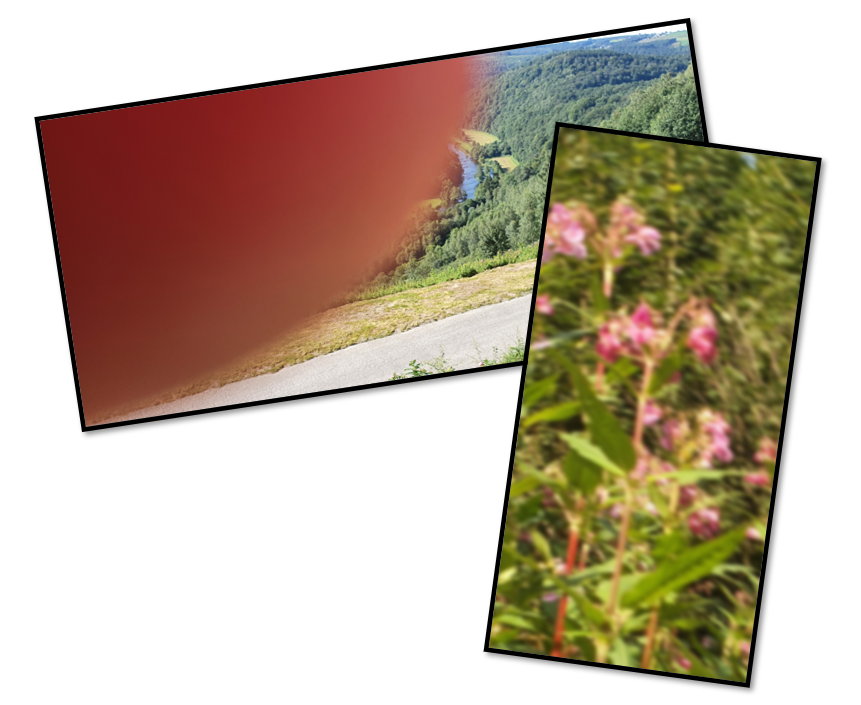
Good pictures start with good scenery. Good NVH testing session starts with proper instrumentation and acquisition. We have therefore decided to combine both and take the Simrod for a drive around our offices in Belgium:
The measurement setup included tachometers, GPS, accelerometers, a microphone, a camera, and random driving.

With 90% of my holiday pictures taken with a smartphone, I can easily check the quality of the photos on the fly. However, when doing traditional instrumentation, it’s easy to make a mistake and end up with a pretty frustrating error propagated throughout your measurement. Fortunately, I can use an instrumentation app to avoid that. The Simcenter Testlab Instrumentation app connects wirelessly to your PC and provides you access to the Channel list in real-time directly from your smartphone.
You can either edit all the properties directly from your phone or tablet, or benefit from a sensor database to automatically fill in all the required properties. Simply snap a photo of a QR code of your accelerometer, and all the required information will be automatically filled in. To fully document the setup, you can take a picture of each sensor, which will be automatically named and stored inside of your Testlab project. That all makes the setup less error-prone and will save a lot of time.
Smile! Let’s measure.
Knowledge is power, and so is accurate documentation. Testlab Neo allows you to annotate your NVH runs with a user-defined set of properties, such as weather conditions, vehicle type, driver’s name, etc.
Another exciting feature is the data annotation, or “keystroke” channel. Runup measurement? Press button 1 on your laptop. Constant speed? Press button 2. Rough road? Button 3… These run and data annotations will ultimately be used as filters for data processing and reporting.
NVH validation – was the picture OK?
Smile everyone! The picture is done! But is it any good?
It’s better to avoid having the same quality dataset as the pictures above. When measuring acoustic or vibration sensors, a quick replay of the data is often the easiest way to validate your measurement. Testlab Neo offers the functionality to replay the traces and calculate and visualize their spectrum content on the fly.
This is illustrated in the video below, where we first replay the trace to confirm that all the dynamic channels are well represented. The controlled runups/rundowns were identified with the keystroke (blue signal). You can, therefore, quickly select segments of interest.
In the second step, we focus on a smaller range of the measurement and enable the Interactive Spectrum map to check the frequency content of the measurement. In this case, with order pass and stop filters to try quick what-if scenarios.
Order calculation and run averaging with Testlab Neo Process Designer
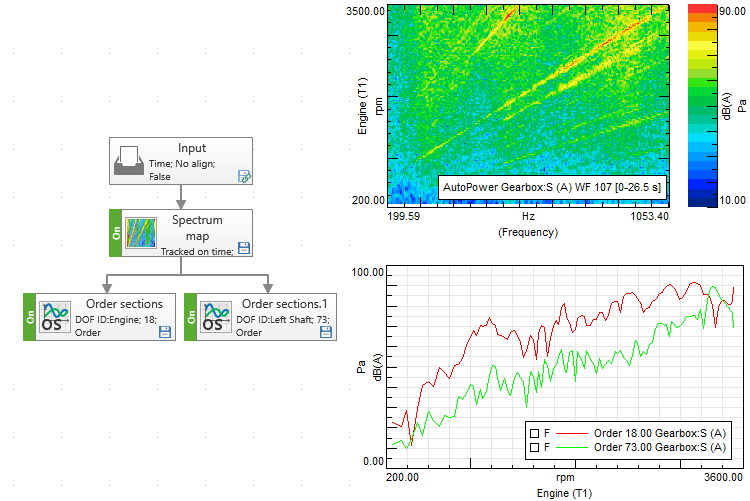
With our freshly measured and validated data, we can go back to the office to start the processing. In a few clicks, you can get confirmation of the most critical frequency content with Testlab Neo Process Designer. Load a run, connect a spectrum map, and press calculate:
Our main content is gear whine: order 73 from the driveshaft (73 teeth on the differential) and order 18 from the electric motor (18 teeth on the input shaft).
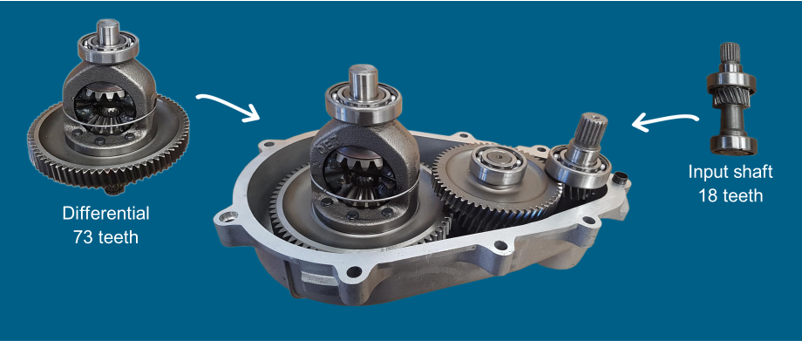
Let’s complete our process with 2 order sections, one from the driveshaft and one from the transmission input shaft:
By loading multiple runups, we can process them all at once and check the average result together with the envelopes. With the “Run average “method in Testlab Neo, you are one click away from the result. Have a look at the example below with 5 NVH runups and the corresponding run average result:
Knowing more: FRF and Point cloud map
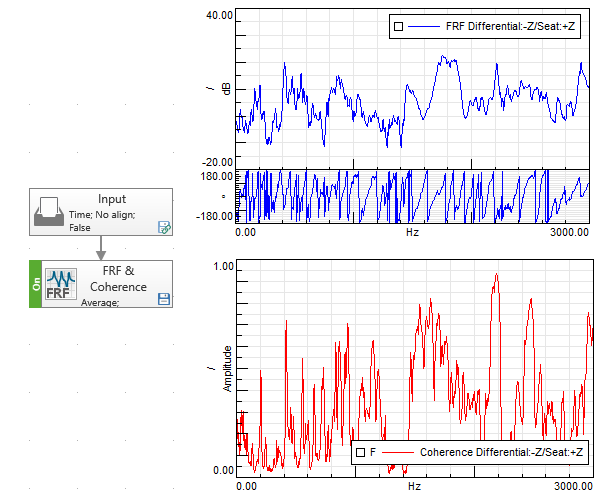
Runups and order section is our typical NVH business. But we can do more, for example, a Frequency Response Function (FRF) calculation between the differential and seat rail acceleration to get the transmissibility. Interesting to check at constant speeds, or on different types of roads, for example! With Testlab Neo Process Designer, you can easily add an FRF calculation to your process.
Coming back to our summer memories, when taking pictures with my phone, I usually get hundreds of them. Same with test data, in one single recording, I can get multiple conditions. Various motor speed, throttle position, road surface, vehicle speed… This opens the door to a different type of analysis. Like a complete acoustic mapping of the prominence order section from the gear whine in the function of speed and power! In the video below, a point cloud map display is created out of a tonality map order section. The gear whine order is visualized in the function of motor speed and vehicle power, directly highlighting the critical speed and power range.
Do you want to learn more about the point cloud map? Check this article!
Reporting
Pictures are validated, sorted… Now it’s time to put this into a nice album.
Reporting with Testlab Neo is not much effort either. From Testlab Neo Process Designer, you can create a report in Microsoft Word or PowerPoint directly from your pivot table using the preview window. Select the data you want to visualize and expand the report by automatically scrolling through the pivot view.
You can learn more about Testlab Neo Reporting capabilities and usage of smart queries in this article.
One step further – Automation and parallel processing
The nice thing with the smartphone photo is that it automatically sorts by category, by localization, it tells me when the picture is not ok because someone blinked an eye…
Testlab Neo can do the same. In this final example, we will use as an input a 25 minutes continuous recording (~1.2Gb of time data) and automatically split it into segments for:
- Multiple runups comparison using synchronous order tracking
- Transmissibility evaluation between differential and seat rail vibration through FRF calculation at a preselected stable speed
- Complete acoustic mapping of the prominence ratio differential order
But because there is nothing worse than inaccurate data, we will also include an automatic check to eventually reject bad runs. A blurred picture? We don’t want it in the album. A too low vehicle acceleration rate? We don’t want it in our final processing. So we will include an automatic check on the vehicle acceleration rate. And it turns out that one of the extracted runups didn’t match our condition. Thanks to the “check” it won’t go any further in the process.
So, do you make it all automatic, or rather like it manual? When it comes to data processing, my choice is made: I let the software do it all automatically.
And I take profit of the time saved to manually arrange my holiday pictures 😊.
- Knowledge Article: Simcenter Testlab: Point Cloud Display
- Blog Post: Simcenter Testlab 2021.1: The power of context-driven data visualization
- Website: Analytics and collaboration