Efficient E-powertrain Measurement
Have you ever encountered a situation in which you failed to account for a vital element in your design or measurements? If so, let’s draw a short parallel to sports.
Imagine a situation in sports where you have just had the ball taken from you by an opponent who snuck up behind you. Your teammates should have warned you by saying, “Be careful, there’s someone behind you.”
Have I overseen something?
Your NVH (Noise Vibration and Harshness) testing device could have served as a warning system. Such alerts could be increased tonal noise caused by the gearing or motor, or increased forces exerted on the attachments to the subframe or body. Why not combine those measurements to avoid blind spots?
Let’s consider the following scenario: You dedicate all your efforts to enhancing the efficiency of your e-motor, only to discover a few days later that your new design is causing an unpleasant noise that is being transmitted into the car’s interior. Perhaps you could have noticed a change in the airborne noise, but what about evaluating the impact on structure-borne noise and using sound quality criteria for assessment?
Here is what I would like to share with you. A complete workflow for analyzing e-powertrain operational measurements for NVH and e-efficiency data by combining the Simcenter SCADAS data acquisition system with a power analyzer. Let me give you a little spoiler: connecting the power analyzer to Simcenter SCADAS is a simple plug-and-play solution using a CAN connection.
Now, what are the benefits of measuring multiple quantities in one measurement? With just one measurement run, we can immediately identify any potential issues. We can directly see if our new strategy/variant meets both efficiency and NVH criteria. But that’s not all. Simcenter Testlab Neo provides all the necessary tools to further investigate and evaluate the data. We can determine if the noise is truly a problem or if it falls within an acceptable range. If the result is not acceptable anymore, perhaps a minor adjustment to the motor’s controls or a major design change on the pole/slot design will resolve the issue.
Why combine e-powertrain NVH and efficiency measurements?
Here is the reason why we talk specifically about efficiency and NVH measurement for e-powertrains. Considering, that both efficiency and NVH are among the top four factors that customers typically prioritize when purchasing a Battery Electric Vehicle (BEV). It is essential to address these aspects in development. To complete the list, the most important factor for customers buying a BEV is the vehicle range, followed by environmental impact, financial savings, and the overall quietness and comfort of the vehicle. It is worth noting that the vehicle range directly relates to the e-powertrain efficiency, while a quiet and comfortable vehicle is reflected in NVH targets.
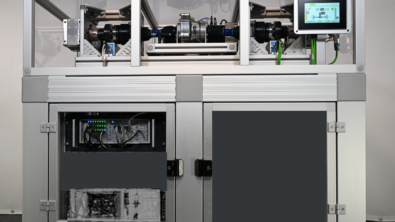
The e-powertrain demo testbench
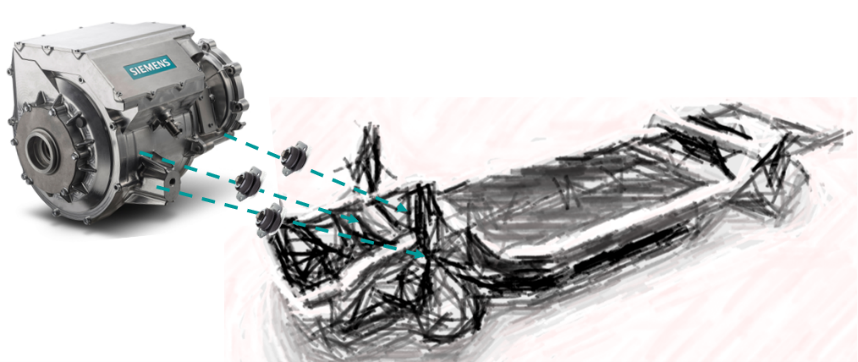
Let us introduce our e-powertrain demo testbench. While the EDU unit is smaller in size compared to a vehicle e-powertrain, the demo testbench offers the advantage of mobility and is using a standard 230V outlet. This is made possible through power recuperation and additional features. It is important in the NVH context, that the powertrain is mounted the same way as on the vehicle, with this we can guarantee the same structural behavior of the powertrain.
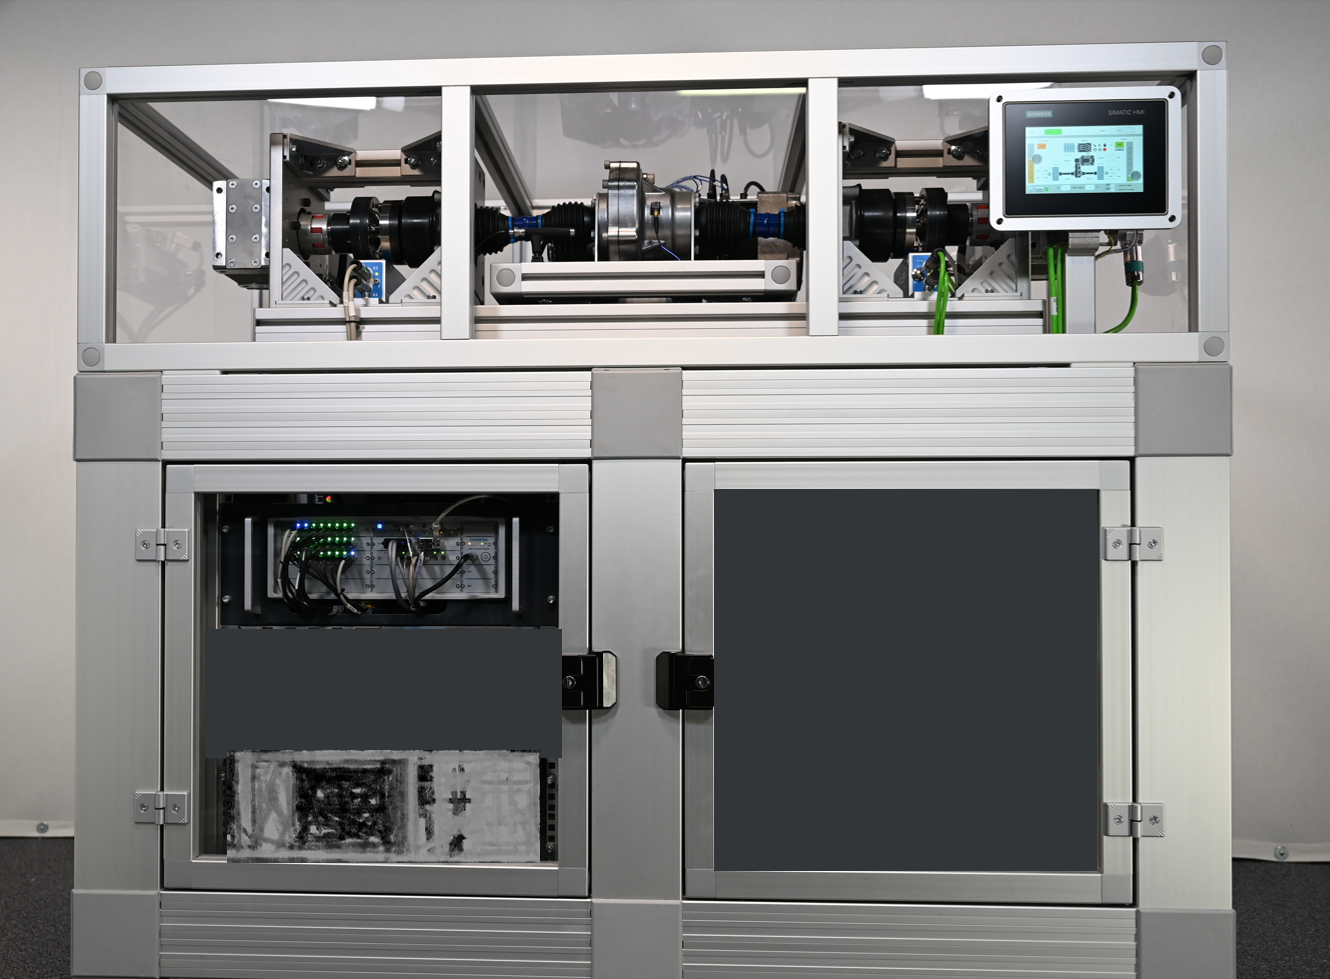
The testbench is equipped with Simcenter SCADAS Mobile, which enables NVH data acquisition. Additionally, the Simcenter SCADAS Mobile is connected to a power analyzer through CAN. It’s important to note that this connection is limited to low frequencies. However, for the purpose of exchanging power and efficiency data, this limitation is totally fine.
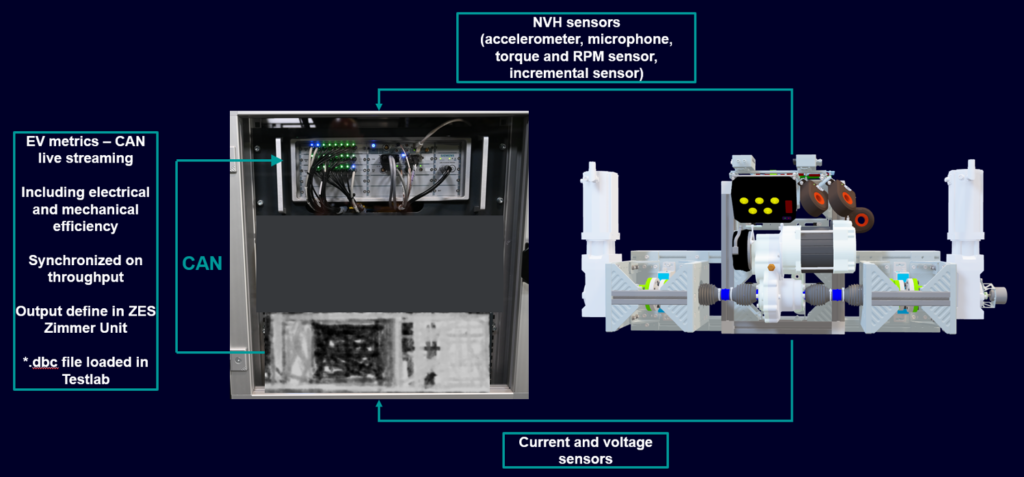
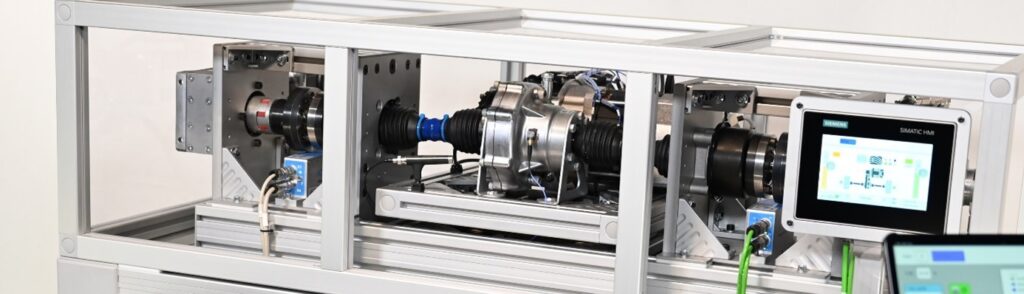
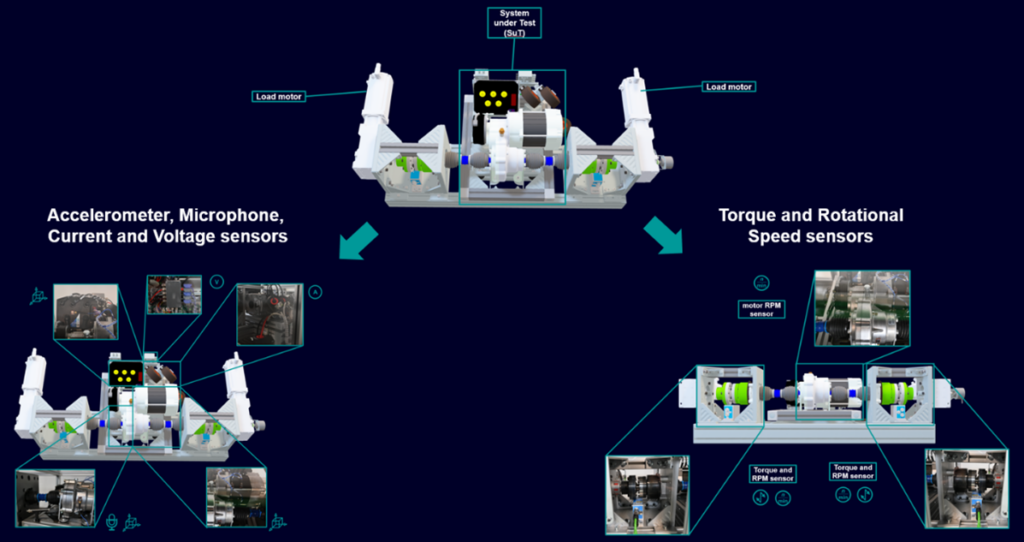
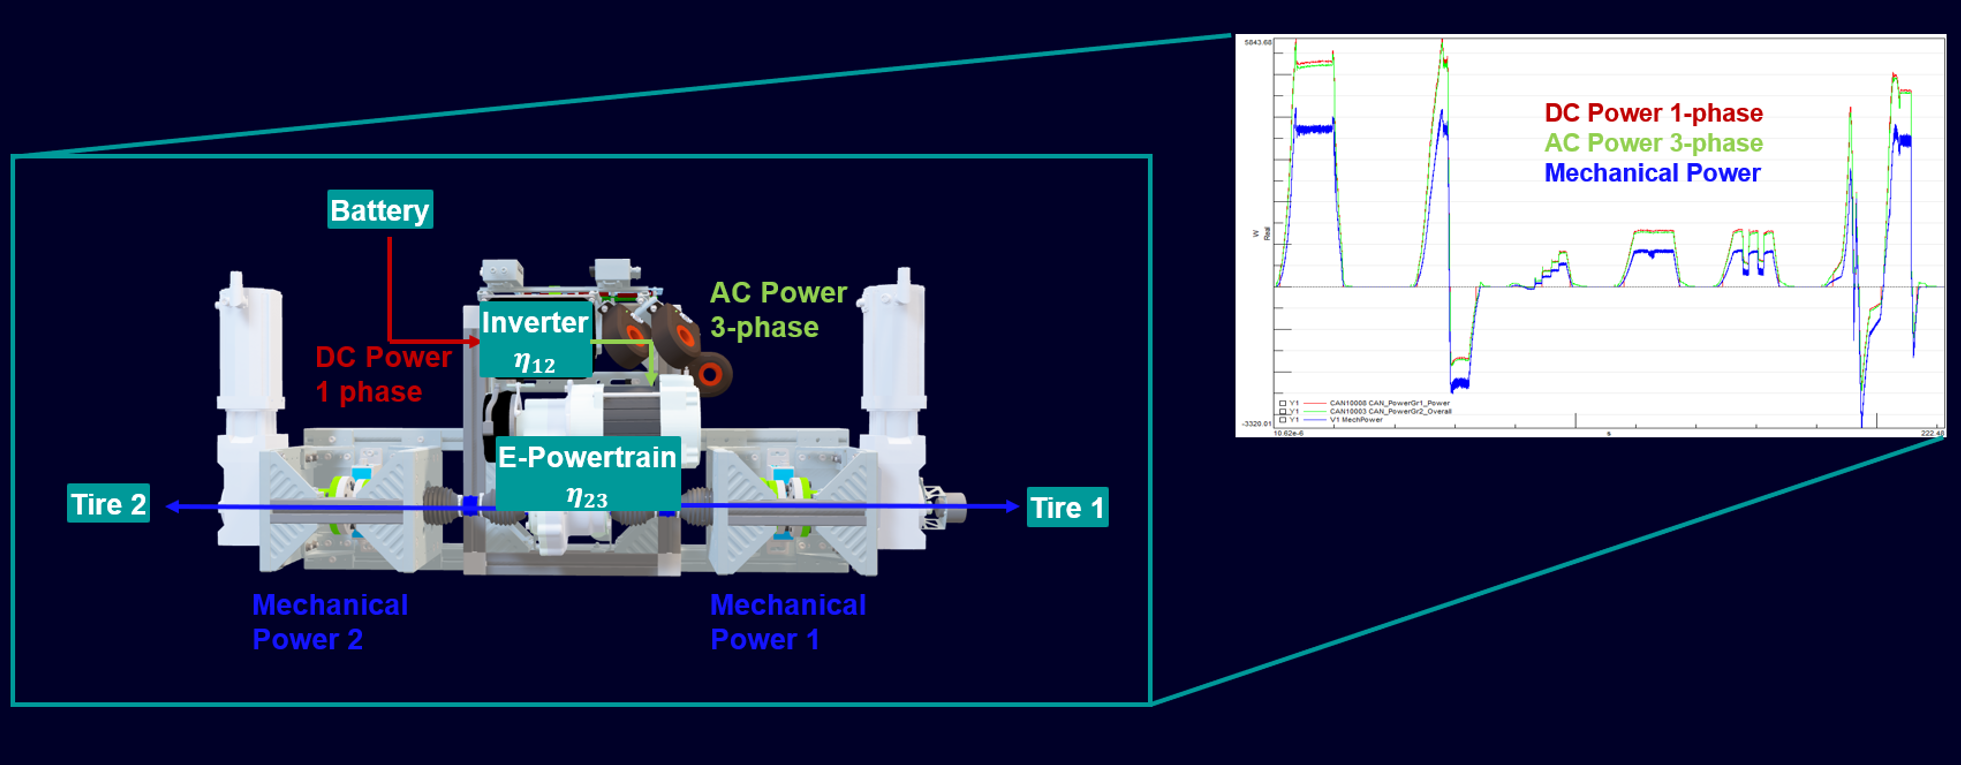
The sensor configuration of the set-up includes the System under Test (SuT) and two load motors, which generate resistance for the SuT. The system is equipped with various NVH sensors, such as accelerometers, microphones, torque sensors, and rotational speed sensors. To analyze e-power and efficiency, we have incorporated current and voltage sensors, as shown in the image below.
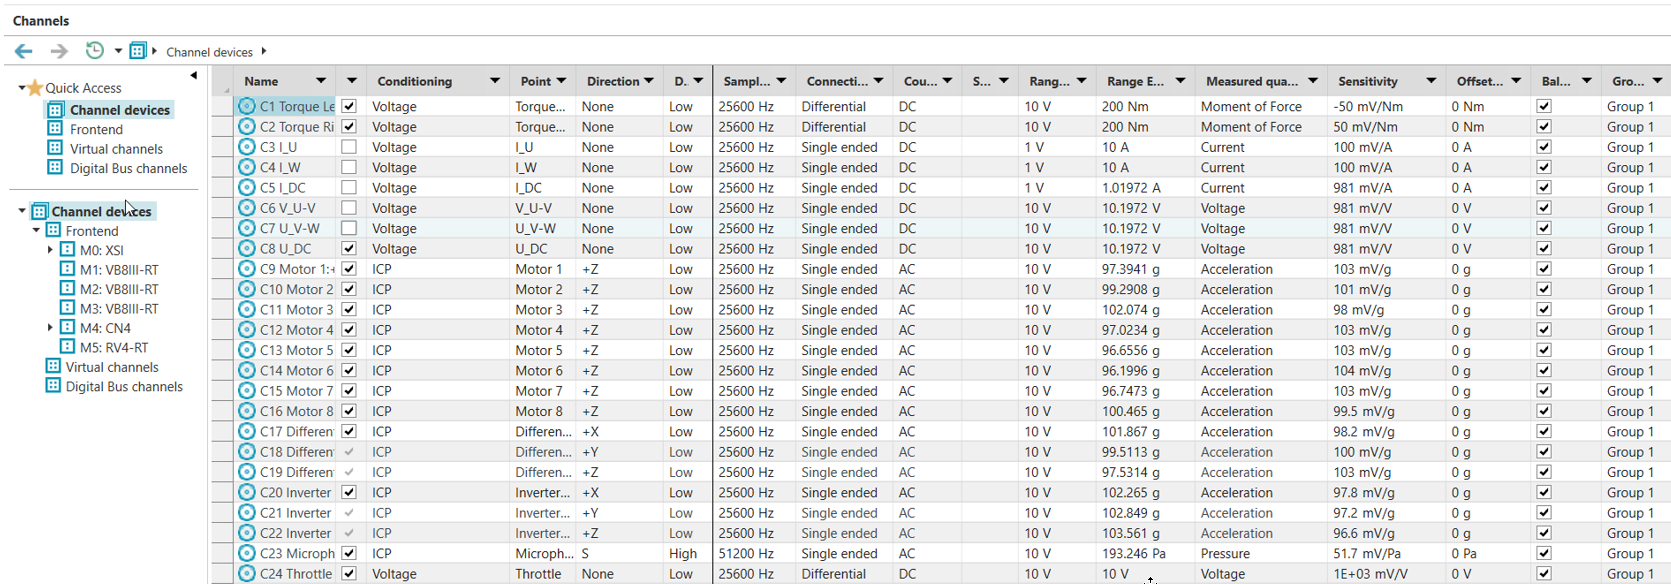
For the channel setup, each sensor channel gets assigned the sensitivity value.
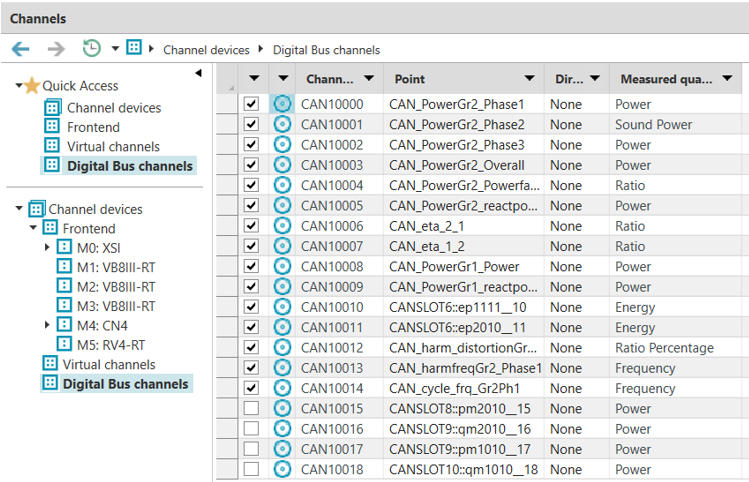
Additionally, the *.dbc file is utilized to identify the CAN channels within Testlab and link the data from the power analyzer to Simcenter SCADAS.
The measurement
The system is designed to initiate the measurement process when the throttle signal is activated and automatically stops when the throttle signal is below a critical value. In the video provided below, you can watch a measurement example. The measured profile includes two consecutive run-up and run-down cycles.
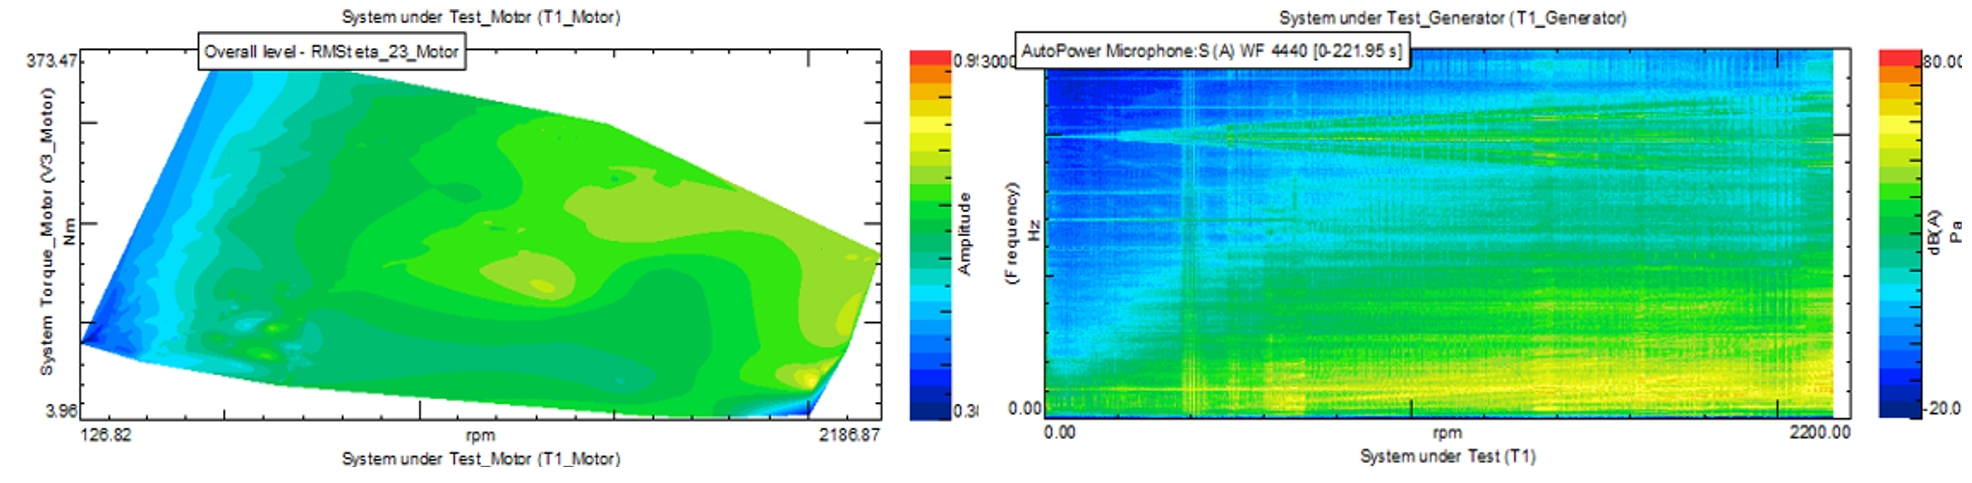
Within the video, you will witness the display of various channels, including the octave spectrum and the spectrum map of the microphone’s pressure data. Additionally, real-time data such as torque, rotational speed, and several streamed data from CAN will be visible.
Have you noticed that some of the CAN efficiency data are above 1? There is a specific reason for this. The efficiency results depend on the power flow direction. In one direction, they will be below 1 (for us, the interesting data). For the other direction, they will be above 1. Thus, we must have toinverse nominator and denominator. We need to be aware of the operating condition of our e-powertrain and of the power flow direction. The e-powertrain can either operate in motor or generator mode.
Next steps
We have demonstrated the data acquisition and measurement setup utilized in our e-powertrain demo testbench. The measurement process itself is completed within a few minutes and the data acquisition is automatically starting and stopping. We are now eager to examine the results obtained. However, this will be discussed in our upcoming blog, where we will showcase the utilization of the Simcenter Testlab Process Designer.
If you have any questions or are curious about any of these topics, please do not hesitate to reach out to us. We are more than happy to assist you.


