A shaker table for vibration testing should not play music
Resonances are great for musical instruments, but not for shaker table for vibration testing when you are testing on a very expensive item, such as a satellite!
The objective of a vibration shaker test is to vibrate a test specimen in such a way that a prescribed vibration level is reached at one or more control accelerometers. That may sound simple, but unfortunately, the reality is usually a bit different.
So, where is the problem?
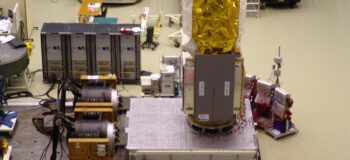
The problem lies in the interface between the shaker and the test article: it consists of shaker armature, an expander head or slip table, and eventually, an attachment fixture. When vibrating at certain frequencies during the tests, structural modes of the interface itself can cause the test article to be over-tested, under-tested or even abort the test by accelerating too much. And this is because the response of the control accelerometer is heavily dependent on the location where it is mounted.
What can we do about it?
Ideally, one makes the fixture resonance free over the test frequency range of interest. However, this can be extremely difficult —if not impossible— to achieve; especially for larger shaker systems.
A more pragmatic and practical approach is to characterize the structural modes of the fixture assembly to better understand how to control them at these resonances.
How can mode shapes help?
As mentioned before, we use one or more control accelerometers in a vibration control test to accommodate the desired acceleration level. If the control accelerometer is placed in a peak of the mode shape, it will not take much effort to realize the vibration profile at this accelerometer location, while the rest of the structure will feel fewer vibration levels leading to sample under-testing.
On the other hand, placing the control accelerometer in a node will push the drive level to the shaker higher than necessary, leading to higher vibration levels in different locations of the shaker table, causing over-testing. In an extreme case, the latter may even lead to the abortion of the full test, as the drive level is pushed to the maximum level in an attempt to reach the desired level on the control accelerometer.
How can we analyze these mode shapes?
It is very easy if we use Simcenter software. Let’s do the analysis on data measured on a slip table. Slip tables are commonly used for lateral tests on spacecrafts. As nothing is infinitely stiff, they will show dynamics after a certain maximum frequency.
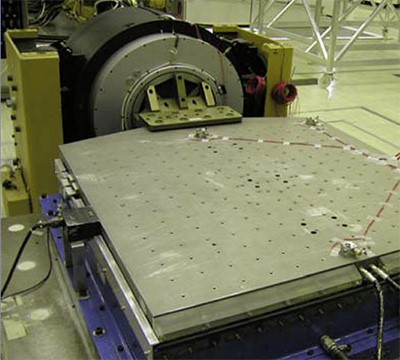
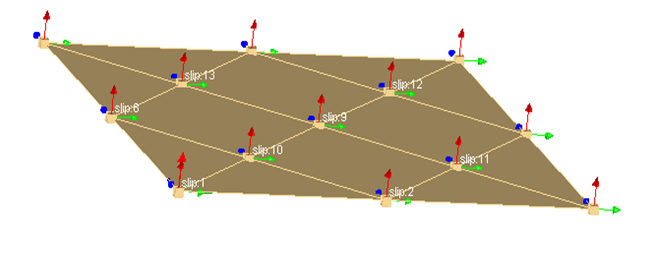
The slip table was instrumented on 13 locations with 3D accelerometers. Measurements were conducted using a Simcenter SCADAS data acquisition system and Simcenter Testlab MIMO FRF Testing software. Only response data (accelerations) were measured during a low level random vibration test.
Data viewing
Let’s first have a look to the measured auto-and crosspower data. A simple drag-and-drop of the entire data set already reveals some peaks. The first peak around 574Hz indicates the first flexible mode.
Operational Deflection Shapes
To have an idea of the deformations of the slip table at the different peaks, we will animate the data on the geometry using Simcenter Operational Deflection Shapes. For the peak around 574Hz ,we see that some points at the center line are relatively static indicating some nodal points.
Operational Modal Analysis
For the higher frequencies we noticed that it is not straightforward to easily separate the close modes using Operational Deflection Shapes (see peak around 1400 Hz). In order to clearly split these closely spaced modes, we use Simcenter Operational Modal Analysis.
No more over- or under testing!
Now you have seen how easy it is to characterize the dynamics of your test infrastructure. Understanding these dynamics will help you position the accelerometers correctly when the test frequency range extends into the flexible frequency range of the shaker table. This will help you run your tests with full confidence. No more over- or under testing!
Do you want to know more about Operational Deflection Shapes and Operational Modal analysis? click here
For more information on vibration control testing, click here.