Road load data for road roughness: the perfect guide to vehicle durability performance

Every vehicle tells a story written in vibrations, impacts, and countless load cycles. While most drivers only notice the harshest bumps and most severe potholes, durability engineers know that it’s often the brutal, seemingly minor road irregularities that ultimately determine a vehicle’s fate. Picture this: a luxury SUV meticulously engineered in Germany, performing flawlessly on smooth autobahns, suddenly facing the unforgiving roads of emerging markets where every kilometer adds years of wear in mere hours. This isn’t just about comfort anymore – it’s about survival!
As vehicle complexity increases with electrification and autonomous systems, understanding road roughness has evolved from a simple ride quality concern to a critical factor in determining whether a $50,000 investment will last five years or fifteen. Welcome to the world of road load data and durability engineering, where the true story of vehicle longevity is written not in mileage, but in the accumulated impact of every bump, crack, and undulation your car will ever encounter.
But how do we quantify this invisible enemy of vehicle longevity? Enter the International Roughness Index (IRI) – the global standard that transforms the chaotic world of road surfaces into measurable data.
Developed in the 1980s during a World Bank study, IRI has become the universal language of road roughness, speaking equally clearly to highway engineers in Hamburg and durability teams in Mumbai. Think of it as the milestone of road profiles: a single number, measured in meters per kilometer (m/km), that tells us whether we’re dealing with the smooth silk of a German autobahn (2-4 m/km) or the washboard challenge of an unpaved rural road (above 8 m/km). For durability engineers, IRI isn’t just another acronym – it’s the key to predicting whether your vehicle development program is headed for triumph or trouble.
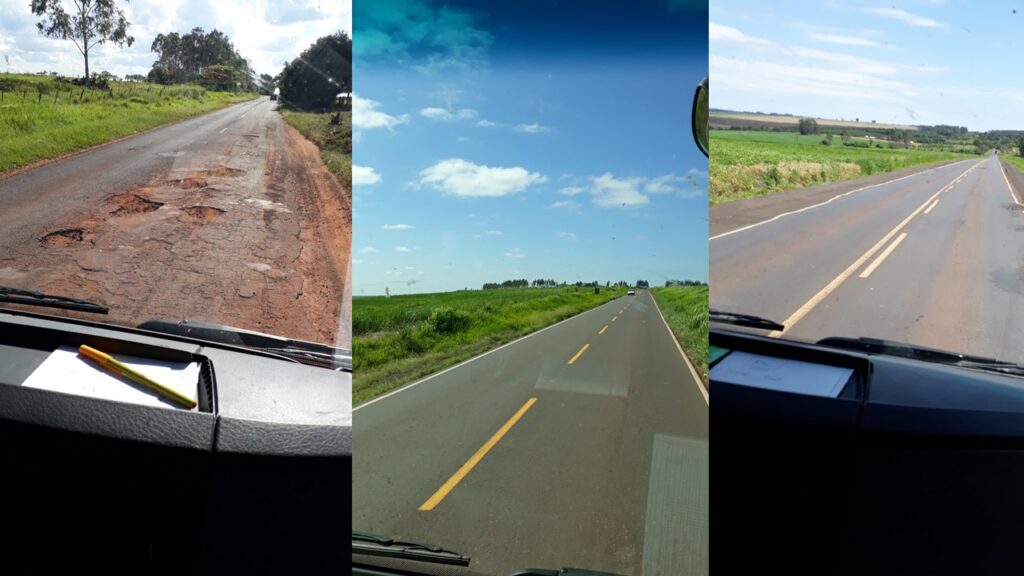
Different road conditions from Brazil (https://resources.sw.siemens.com/en-US/case-study-volvo-trucks-brazil/)
Understanding IRI
At its core, IRI simulates a quarter-car model traveling over a road surface, measuring accumulated suspension motion per distance traveled. Think of it as a mathematical representation of every bump, pothole, and undulation your vehicle encounters. The scale typically ranges from 0 m/km (imagine a perfectly smooth surface) to over 20 m/km (think of the worst unpaved road you’ve ever seen).
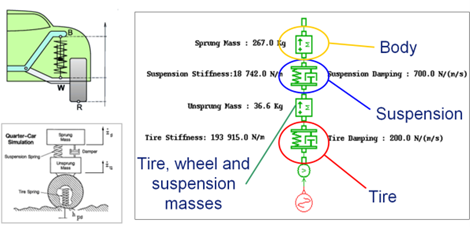
A quarter car model made in Simcenter Amesim
For context, a new highway typically measures around 2-4 m/km, while a well-maintained unpaved road might register 6-8 m/km. However, many vehicles, especially in emerging markets, regularly operate on roads with IRI values exceeding 12 m/km.
The durability challenge
Here’s where it gets interesting for us engineers: road roughness doesn’t just affect ride comfort – it fundamentally impacts the reliability and the durability performance of the vehicles. When developing vehicles, we must consider how different systems interact under these conditions. A suspension system designed for European roads (IRI 2-4 m/km) will behave very differently when subjected to roads with three or four times that roughness value.
Take, for instance, the classic suspension design challenge. While we might optimize damping characteristics for ride comfort on smooth roads, the same setup could lead to accelerated component wear on rough surfaces. The energy input from road irregularities compounds over time, affecting not just the suspension but the entire vehicle structure.
System interactions
What makes road roughness particularly challenging is its cascading effect through vehicle systems. Consider how vibrations from rough roads travel through the vehicle structure. They don’t just stress the suspension components; they affect everything from powertrain mounts to electrical connections.
The chassis experiences complex load patterns that can lead to fatigue in unexpected locations. Electronic components, often overlooked in rough road discussions, face their own challenges. A sensor mounted in a location that’s perfectly suitable for smooth roads might face reliability issues when subjected to continuous high-amplitude vibrations.
Practical IRI analysis (road roughness) using Simcenter Testlab
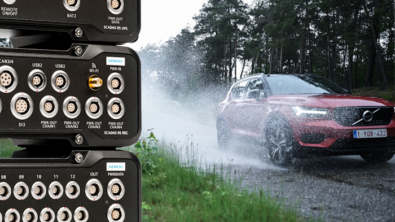
Let’s move from theory to practice. In my next tutorial, I’ll demonstrate how to analyze road roughness using our Simcenter Testlab. We’ll work with real measurement data (measured with Simcenter SCADAS RS) from a recent development project, including road profile (elevation of the vehicle) and travelled distance besides many other channels.
And in Simcenter Testlab we’ll create a single processing flow which includes:
- Calculation of the distance travelled on the surface we’ll analyze,
- The responses from a quarter car model by using the measured road profile as input
- Here we’ll also import a system level simulation model, created in Simcenter Amesim, into Simcenter Testlab
- Creating body and suspension displacement by using responses and we’ll correct the anomalies (spikes, drifts, offsets…)
- Calculating IRI by the displacement difference in between unsprung and sprung mass divided by travelled distance,
- Automatically labelling road conditions based on IRI classification as very smooth, smooth, fair, rough or extremely rough due to defined standards.

A single process on Simcenter Testlab to classify the road conditions based on IRI
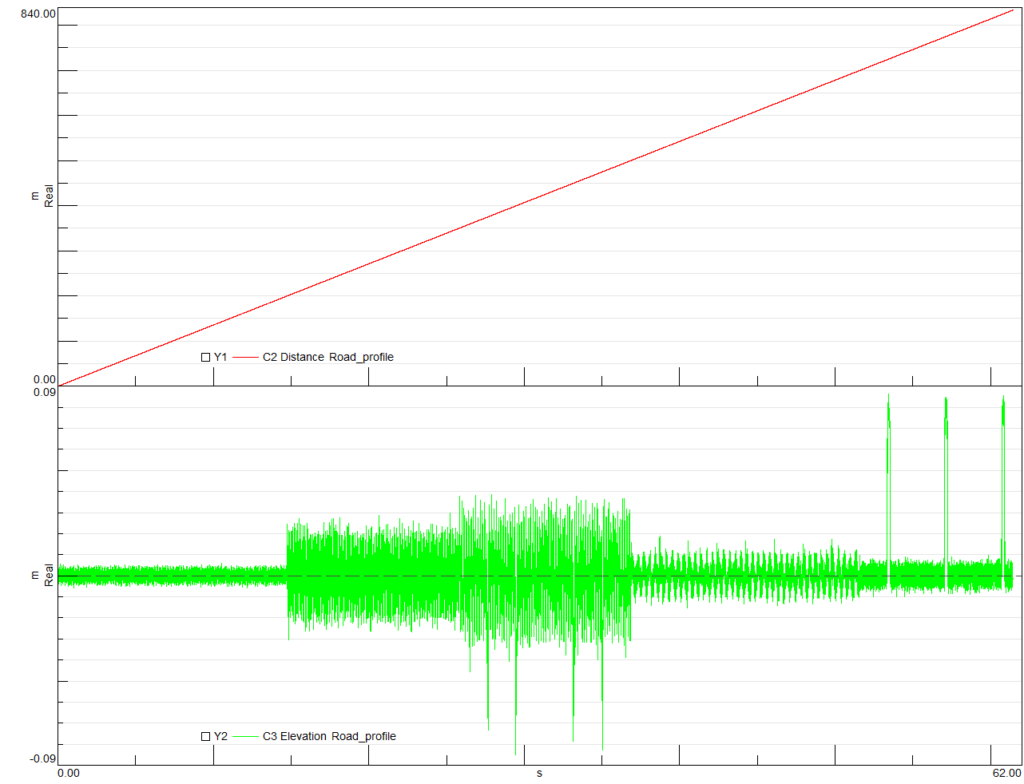
Red curve for measured accumulated distance and green curve for measured road profile (elevation of the vehicle over a certain road condition)
After executing the single process on Simcenter Testlab, result seemed like shown below.
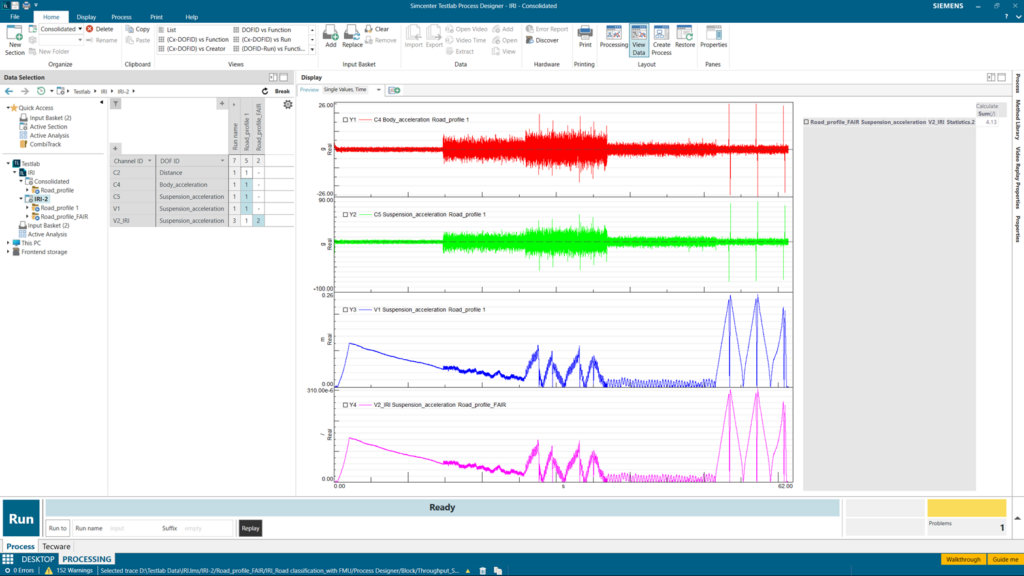
Red curve: body acceleration, green curve: suspension acceleration, blue curve: displacement difference of suspension and body, magenta curve: IRI (m/km) over time and statistical sum result is for IRI
As seen on the left side of the screen under Data Selection pane from the above picture, measured run is now automatically labelled as ‘Fair’ since the sum of IRI is in between 4-6 m/km (4.13).
| Road condition | IRI result | Riding conditions | Typical speed |
| Very smooth | IRI < 2 m/km | Perfect riding conditions Examples: New highways, airport runways | 120 km/h |
| Smooth | IRI = 2-4 m/km | Good riding comfort Examples: Well-maintained highways, new urban roads | 80-120 km/h |
| Fair | IRI = 4-6 m/km | Acceptable riding comfort Examples: Older highways, normal urban roads | 60-80 km/h |
| Rough | IRI = 6-8 m/km | Reduced riding comfort Damaged roads, well-maintained gravel roads | 40-60 km/h |
| Extremely rough | IRI > 8 m/km | Poor riding comfort Unpaved roads, damaged urban roads | < 40 km/h |
Engineering solutions
The solution lies in a holistic approach to vehicle development. Instead of treating road roughness as a suspension issue, we need to consider it as a whole-vehicle challenge. This means:
1. Understanding load paths through the entire vehicle structure
2. Considering system interactions under various road conditions
3. Implementing robust design principles in all components
4. Developing adaptive systems that can respond to changing road conditions
Looking forward
As we move toward more connected and autonomous vehicles, understanding and accounting for road roughness becomes even more critical. Future vehicles will need to not just survive rough roads but maintain optimal performance of all systems under these conditions.
So, modern vehicles add another layer of complexity to this challenge. With the increasing integration of advanced driver assistance systems (ADAS) and autonomous features, sensor reliability under rough road conditions becomes critical. A slight misalignment of a camera or RADAR unit due to continuous vibration could compromise safety systems.
Please do not hesitate to reach me out (safak.has@siemens.com) for more details and stay tuned for the upcoming blogs!