Introducing Dashboard Designer: A new intuitive tool for Insights Hub users to turn data into actionable insights

On your organization’s journey to digitalization, Siemens Xcelerator business platform delivers a curated portfolio of IoT-enabled, state-of-the-art hardware and software building blocks that are easy, flexible and open, as well as a powerful ecosystem of partners, and a marketplace. Within Siemens Xcelerator, the industrial Internet of Things enables you to connect equipment, machines and production lines to collect data, analyze and discover insights, and make informed data-driven decisions. Once you harness the power of IoT, you’re presented with a wealth of data that you can leverage to improve your operations.
But many organizations are still challenged after collecting all this data. First, managing large amounts of raw data can be difficult, then making sense of the data and drawing out insights without the help of knowledgeable experts adds another layer of challenge. And ultimately, organizations lack to ability to leverage this data into actionable insights that add business value and align with your goals and processes.
Siemens Insights Hub, the industrial IoT as a service solution, is introducing Dashboard Designer, an exciting new out-of-the-box solution that brings immediate value to your organization. Taking our customer experience and operations setup into account, we’re offering a tool that delivers enhanced capabilities to make discovering and acting on data more intuitive, even without data, IT or design expertise. This enhancement is another way that we are empowering industries to generate new operational insights that are actionable, meaningful and intelligent, while being flexible enough to adapt to any customer’s specific processes and systems.
What is Dashboard Designer?
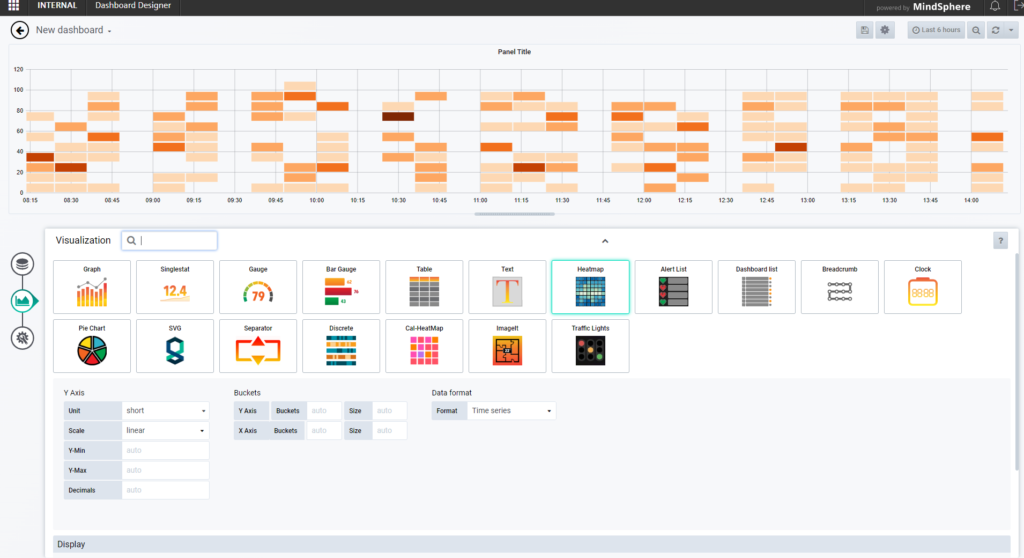
Dashboard Designer is an exciting new dashboarding and visualization app that integrates seamlessly with Insights Hub, enhancing our industry solutions like Remote Service and Energy Management to make them even easier and more accessible. This application is highly customizable and flexible, and leverages dashboard and visualization technology to enhance users’ experience with data and metrics, making it easy to create beautiful and informative dashboards. And while users don’t necessarily need programming knowledge, you’re more than welcome to program the dashboard to create customized visualization panels.
Who can use Dashboard Designer?
With Dashboard Designer, anyone can query, visualize, request alerts, and understand metrics from any asset or area of their organization, and can create personalized visualizations that make sense to them. Here’s how that may look within different environments:
- Operations, plant and service managers can use Dashboard Designer dashboard and visualizations to make informed decisions and improve operations. By leveraging the data, they can monitor overall equipment effectiveness (OEE) and make decisions on machine availability, production performance and product quality.
- Production and product engineers can use Dashboard Designer dashboard and visualizations to improve the manufacturing process by establishing closed-loop manufacturing – including Product Twins and Factory Twins. This allows them to simulate the manufacturing process to make decisions about their machinery and monitor machine health.
- Individual device owners can use Dashboard Designer to determine if a change in usage behavior has impacted their energy consumption as they look to the metrics to identify the most efficient behaviors, so they can save energy and increase the battery life of their device.
Dashboard Designer is the newest, most sophisticated dashboarding app to date. In addition to the dashboarding capabilities for users within Operation Insights, it includes maker capabilities, allowing manufacturers to customize visualization by developing their own unique views in alignment with their industry processes, goals and KPIs.
The best part? Dashboard Designer has been created to be easy, flexible and intuitive. Users don’t need any advanced programming skills or capabilities and data results are immediate and easily visualized.

What’s next for Insights Hub users?
When you’re ready for more advanced analytics, Business Intelligence Analytics with Visual Explorer is the bridge between dashboarding and analytics, allowing you to visually analyze and dig even deeper into the data for advanced intelligence.
Want to learn more? Contact an Insights Hub expert and unleash the power of the industrial IoT and its possibilities.
Other Insights Hub posts you might be interested in: