Even More UVM Debug in Questa 10.2
We’re really excited about the recent Questa 10.2 release, and I’m sure you’ll be just as excited when you check it out. For you UVM-philes out there, we’ve extended our industry-leading UVM Debug features to make your life even easier. I’ll present a quick overview of the new features here, but you’ll really want to get your hands on 10.2 and take a more in-depth look for yourself.
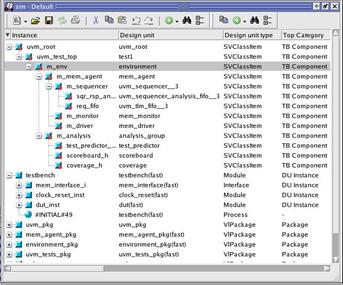
The first thing you’ll notice is that we’ve enhanced to Structure Window (usually located in the upper left of the debugger) to show the class type of each UVM component in your testbench. This will make it easier to know exactly what your factory settings and other configuration settings have yielded as you built your testbench.
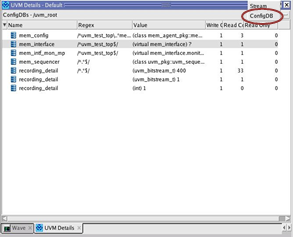
One of the most common requests we’ve gotten is to provide a way to see what exactly is happening with the configuration database (uvm_config_db). In the UVM Details window, you can now see the values that are available to the selected component, and by right-clicking you can see who wrote the value and where the write occurred.
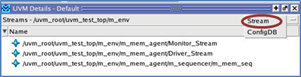
In the Stream view of the Details window, you can see all of the transaction streams being recorded by the selected component.
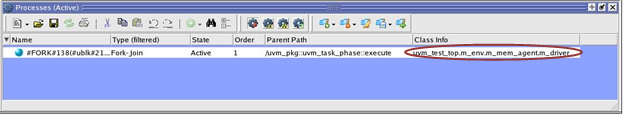
Also, when debugging UVM processes, the Processes Window now includes the hierarchical path to the component that initiated the process.
Lastly, for those of you who may not be GUI-centric, we’ve added a new “uvm” command to the command-line interface in the transcript window (or via “.do” files):
uvm subcommand [args...]
where the “subcommand” lets you choose from a number of options. The default subcommand (and in my opinion, the coolest) is the “call” command, which allows you to call UVM functions directly from the command line. You can even call functions in UVM components by referring to the components via their hierarchical name
uvm call test_top.env1.fab.get_full_name
or via a handle provided by Questa (as seen in the Class Instances window).
call @myClassType@223.get_full_name
There are other useful UVM commands that I won’t go into here, but you should definitely check them out. So, what are you waiting for? To find out more information about Questa with this link: http://www.mentor.com/products/fv/questa/


Comments
Leave a Reply
You must be logged in to post a comment.
Where do go to download Questa 10.2?
Is it available for evaluation and what are the normal evaluation terms?
Is there an evaluation?