Part 11: The 2016 Wilson Research Group Functional Verification Study
ASIC/IC Power Trends
This blog is a continuation of a series of blogs related to the 2016 Wilson Research Group Functional Verification Study (click here). In my previous blog (click here), I presented our study findings on various verification language and library adoption trends. In this blog, I focus on power trends.
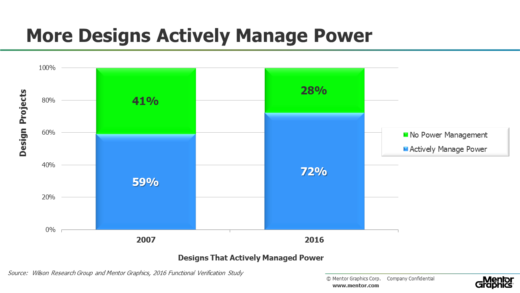
Today, we see that about 72 percent of design projects actively manage power with a wide variety of techniques, ranging from simple clock-gating, to complex hypervisor/OS-controlled power management schemes (see Figure 1). This is essentially unchanged from our 2014 study.

Figure 1. ASIC/IC projects working on designs that actively manage power
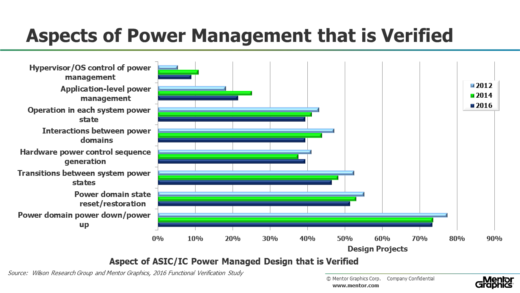
Figure 2 shows the various aspects of power-management that design projects must verify (for those 72 percent of design projects that actively manage power). The data from our study suggest that many projects are moving to more complex power-management schemes that involve software control. This adds a new layer of complexity to a project’s verification challenge, since these more complex power management schedules often require emulation to fully verify.

Figure 2. Aspects of power-managed design that are verified
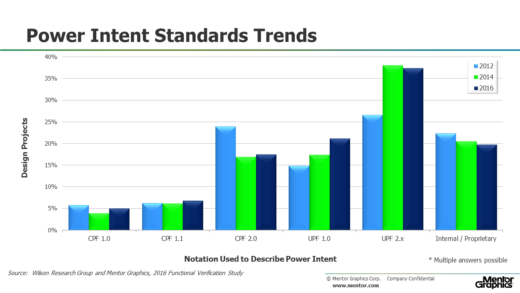
Since the power intent cannot be directly described in an RTL model, alternative supporting notations have recently emerged to capture the power intent. In the 2016 study, we wanted to get a sense of where the industry stands in adopting these various notations and what we found was essentially no change from our 2014 study. For projects that actively manage power, Figure 3 shows the various standards used to describe power intent that have been adopted. Some projects are actively using multiple standards (such as different versions of UPF or a combination of CPF and UPF). That’s why the adoption results do not sum to 100 percent.

Figure 3. Notation used to describe power intent
In an earlier blog in this series, I provided data that suggest a significant amount of effort is being applied to ASIC/IC functional verification. An important question the various studies have tried to answer is whether this increasing effort is paying off. In my next blog (click here), I present verification results findings in terms of schedules, number of required spins, and classification of functional bugs.
Quick links to the 2016 Wilson Research Group Study results
- Prologue: The 2016 Wilson Research Group Functional Verification Study
- Understanding and Minimizing Study Bias (2016 Study)
- Part 1 – FPGA Design Trends
- Part 2 – FPGA Verification Effort Trends
- Part 3 – FPGA Verification Effort Trends (Continued)
- Part 4 – FPGA Verification Effectiveness Trends
- Part 5 – FPGA Verification Technology Adoption Trends
- Part 6 – FPGA Verification Language and Library Adoption Trends
- Part 7 – ASIC/IC Design Trends
- Part 8 – ASIC/IC Resource Trends
- Part 9 – ASIC/IC Verification Technology Adoption Trends
- Part 10 – ASIC/IC Language and Library Adoption Trends
- Part 11 – ASIC/IC Power Management Trends
- Part 12 – ASIC/IC Verification Results Trends
- Conclusion: The 2016 Wilson Research Group Functional Verification Study


Comments