Discover what’s new in model-based quality (August 2023)
Next-level manufacturing quality with Siemens digital manufacturing software.
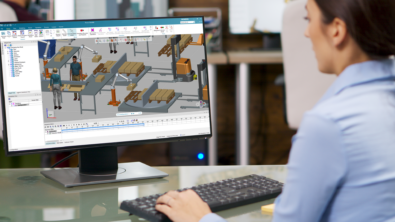
Companies of all sizes in all industries use Siemens digital manufacturing software to meet their strategic objectives in today’s challenging business environment. Digital manufacturing helps turn innovative ideas into transformative products with more manufacturing flexibility and greater production efficiency and model-based quality (MBQ) software ensures that those products meet the quality requirements that your customers demand.
Model-based quality (MBQ) is part of the Siemens closed loop quality solution for failure mode and effects analysis (FMEA), control and inspection planning, variation simulation analysis, metrology, and dimensional planning and validation (DPV).
Siemens MBQ delivers exciting new advancements. From variation analysis and CMM inspection programming to data collection, analysis, and reporting, model-based quality software helps companies reduce risk and ensure higher quality products and processes well in advance of production.
Keep reading to learn about the exciting new capabilities for MBQ software releases based on NX 2306, Teamcenter 14.3 and Active Workspace 6.3.
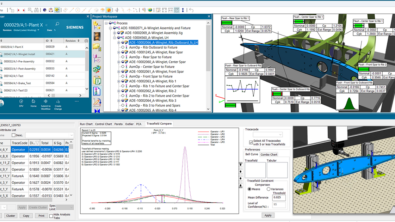
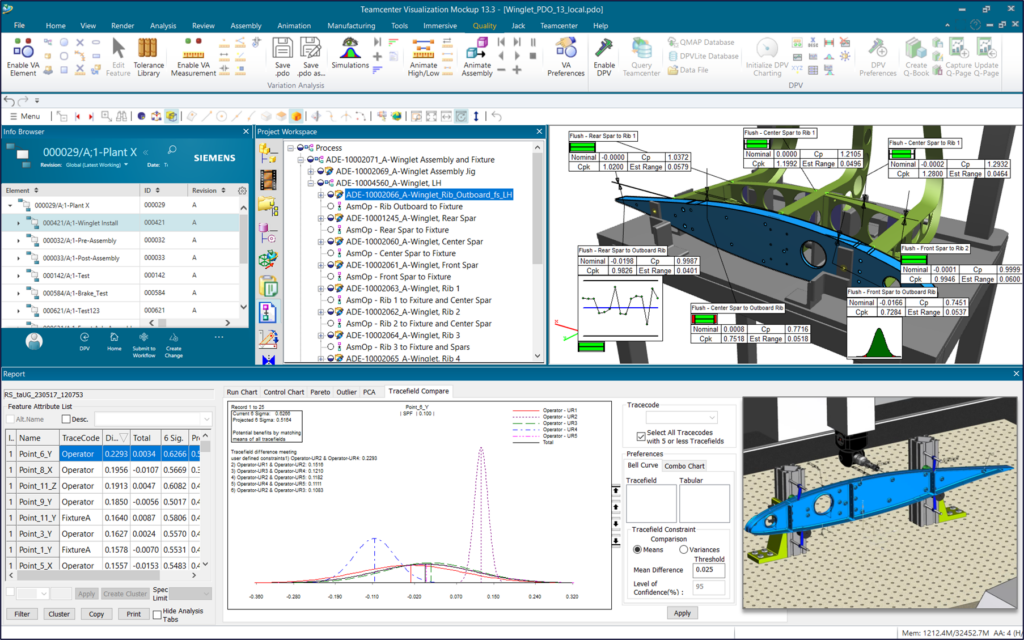
Variation analysis with Teamcenter Visualization
Variation Analysis (VA) software helps you simulate manufacturing and assembly processes to predict and quantify the amounts and causes of variation in a robust 3D environment. The software leverages Monte-Carlo simulation and a ConJoin assembly constraint engine for static and kinematic assembly operations within the full range of allowable constraints, and integration to finite element analysis solvers for comprehension of component flexibility due to clamping, welding and springback. VA (a.k.a. VisVSA) is based on the Teamcenter Visualization framework and can run in both connected (managed) and disconnected (standalone) fashion.
The following enhancements are available in Variation Analysis for Teamcenter Visualization 14.3.
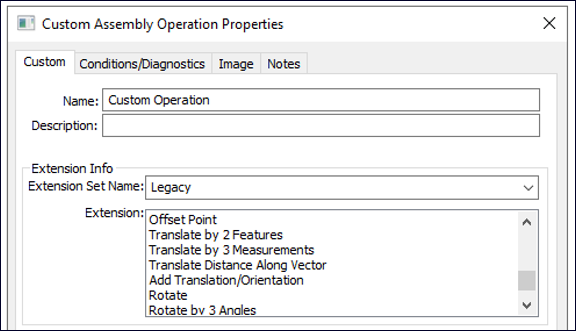
New custom operations
This enhancement introduces advanced modeling capabilities in custom operations for assembly and measurement.
New custom assembly operations:
- Project to surface
- Translate distance along vector
- Add translation/orientation
- Rotate by 3 angles
- Set vector
- Best fit plane
New custom measurement operations:
- Distance: Point to line
- Distance: Point to tab-slot-plane
The online documentation now includes usage information on all custom operations.
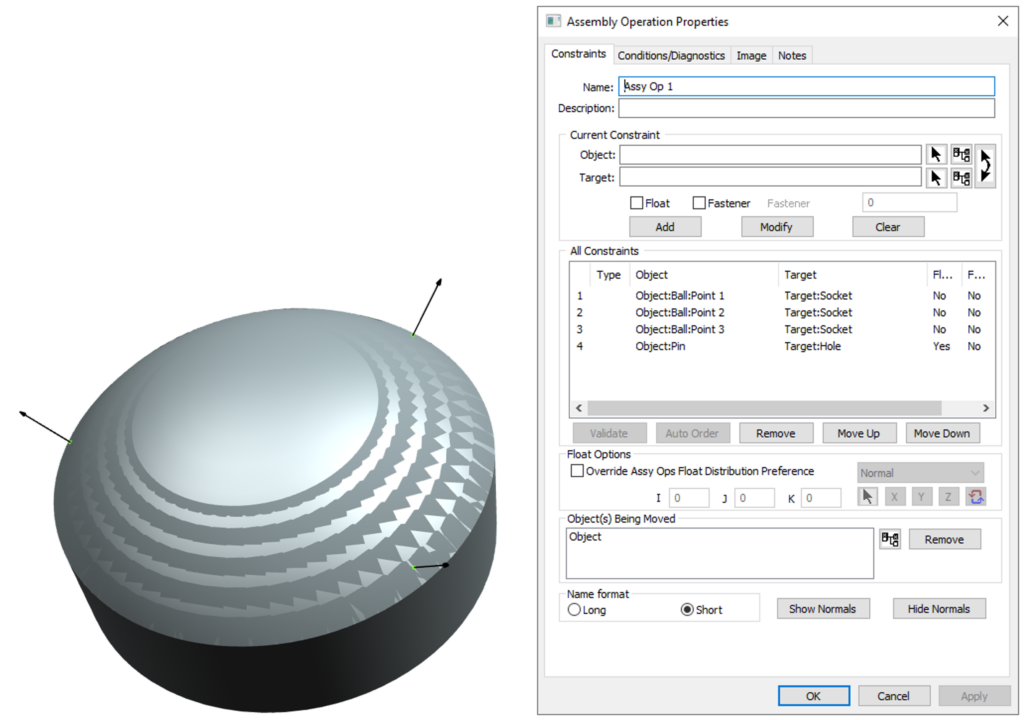
Spherical assembly operations
This enhancement delivers basic support for spherical features in assembly operations.
- New spherical primary move type: spherical
- Support for ‘three point to sphere’ or ‘sphere to point’ constraint pairs
- Hole to pin secondary constraint pair also supported
Additional content and features
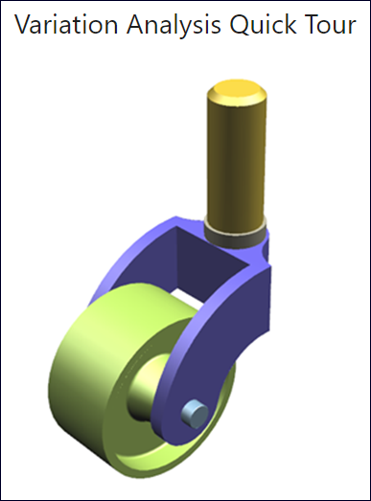
This release of Variation Analysis offers a new and improved Quick Tour tutorial included in the online help, multi-face selection for spherical feature definition and improved sorting for summary reports.
Variation analysis with NX
NX VSA software offers the same capabilities as VisVSA, but directly in the NX environment.
The following new capabilities are available in NX VSA for NX 2306.
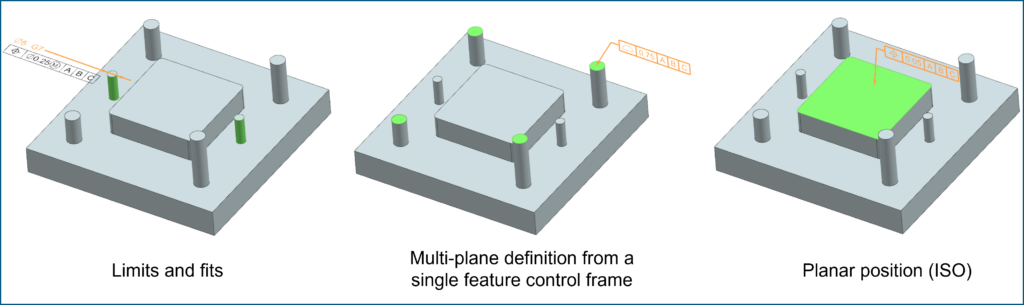
PMI flowdown
This enhancement adds additional PMI flowdown support and expands the analysis capability. Enhancements include limits and fits, multi-plane definition from a single feature control frame and planar position (ISO).
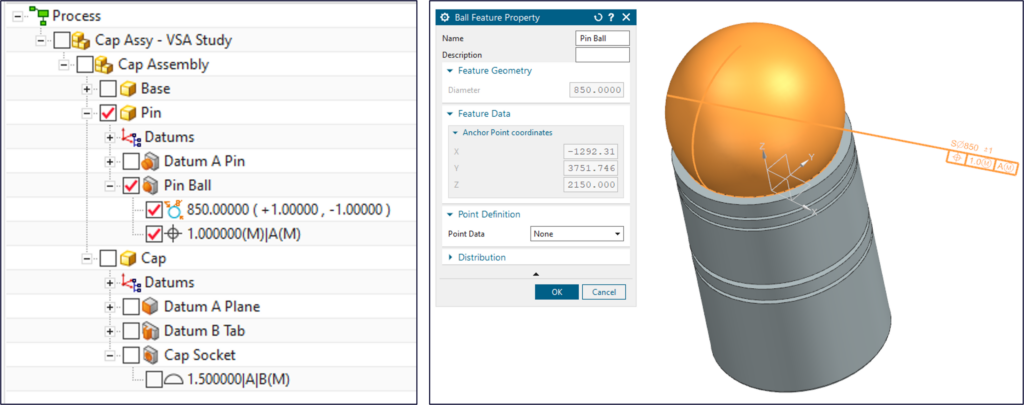
Spherical features
This enhancement introduces two new feature types, ball and socket, to expand analysis fidelity. The ball feature represents the material inside the sphere and the socket feature represents the material outside the sphere. You can see these new features in the VSA navigator, and they are supported in point-based assembly and measurement operations.
Feature visualization
You now can view component and feature geometry independently for better visualization of the applied variation. You control visualization of features independently through individual check boxes and can conveniently view a combination of features and components.
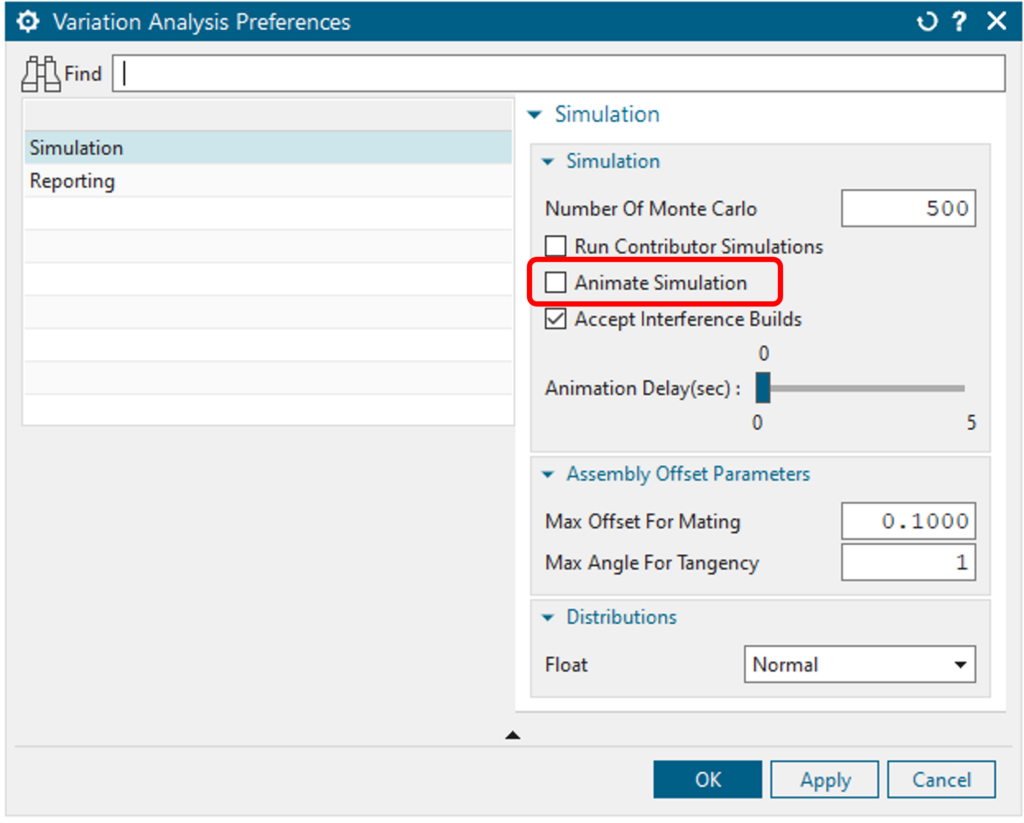
Animation of variation
This enhancement simplifies animation preferences to a single option. You now can control visibility of parts and features in the VSA navigator. This allows you to select the desired combination of components and/or features you would like animated during simulations.
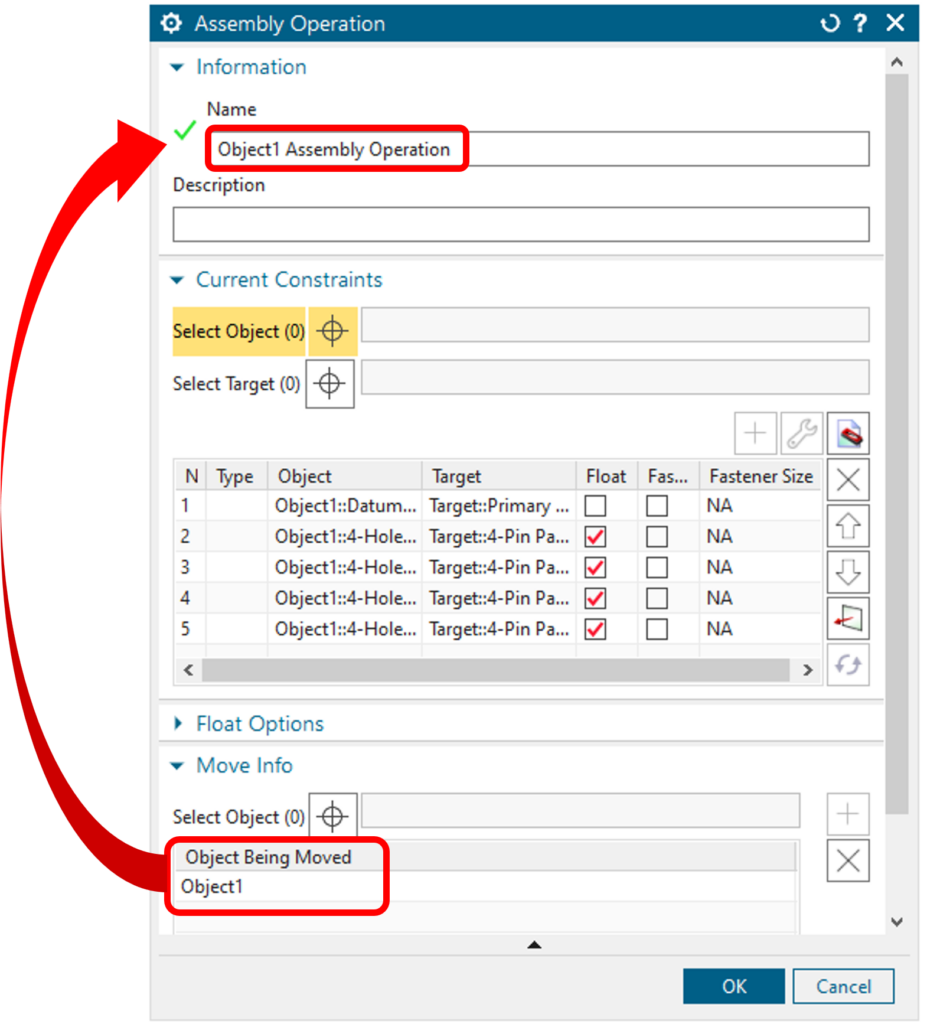
Assembly operation naming
Operation names now can be automatically generated for the objects being moved in an assemlby operation. This streamlines the assembly operation creation process. You may still key-in a specific operation name, if desired.
Dimensional planning and validation (DPV)
DPV provides automated report publishing to automatically populate preconfigured report templates with collected quality measurements for lifecycle metrology data reporting and analytics. You can produce historical summary reports to consolidate extremely large sets of measurement data, helping your decision makers to quickly review this information and use it to make metrics-based design and manufacturing decisions. With access to this information, you can compare processes and/or plants (factories), understand process stability and summarize your company’s performance over time.
The following new capabilities are available in DPV for Teamcenter 14.3 and Active Workspace 6.3.
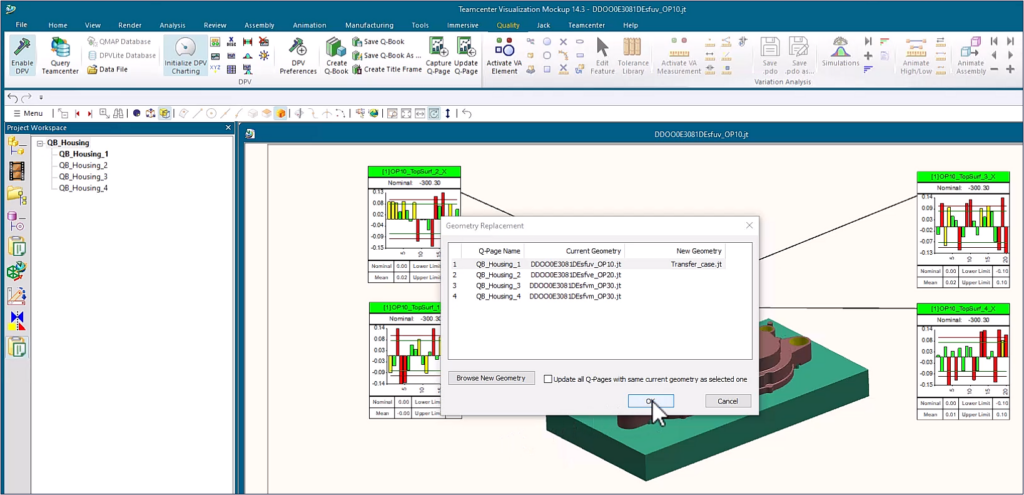
Q-Book updating
The replace geometry function offers the capability to replace geometries within a Q-Book by another geometry or a new revision of the geometry and allows for replacing one or more geometries within a single workflow.
The zoom level, view angle, sections and colors for the original geometries will apply for the new geometries that you include. You can have different geometries in multiple assets per Q-Page.
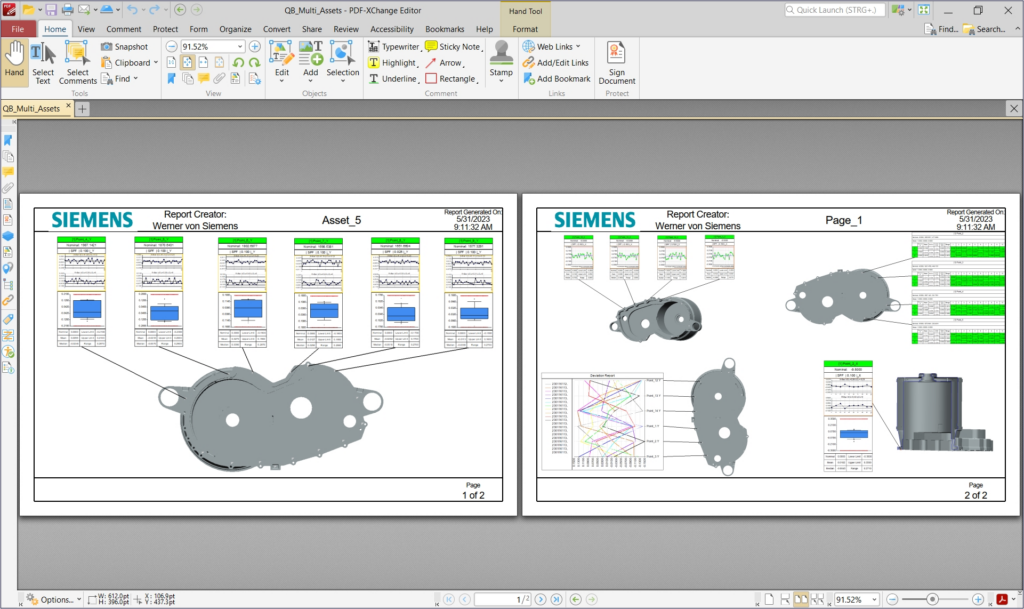
Report content preview (PDF)
The PDF preview functionality offers the user to preview the content of every Q-Page of a Q-Book before generating a report or saving the Q-Book by the view Q-Asset command.
You can save the entire Q-Book as a PDF file before generating the PDF report. The PDF file you save is not connected to the database and is meant to be a preview; therefore, its content will not be updated.
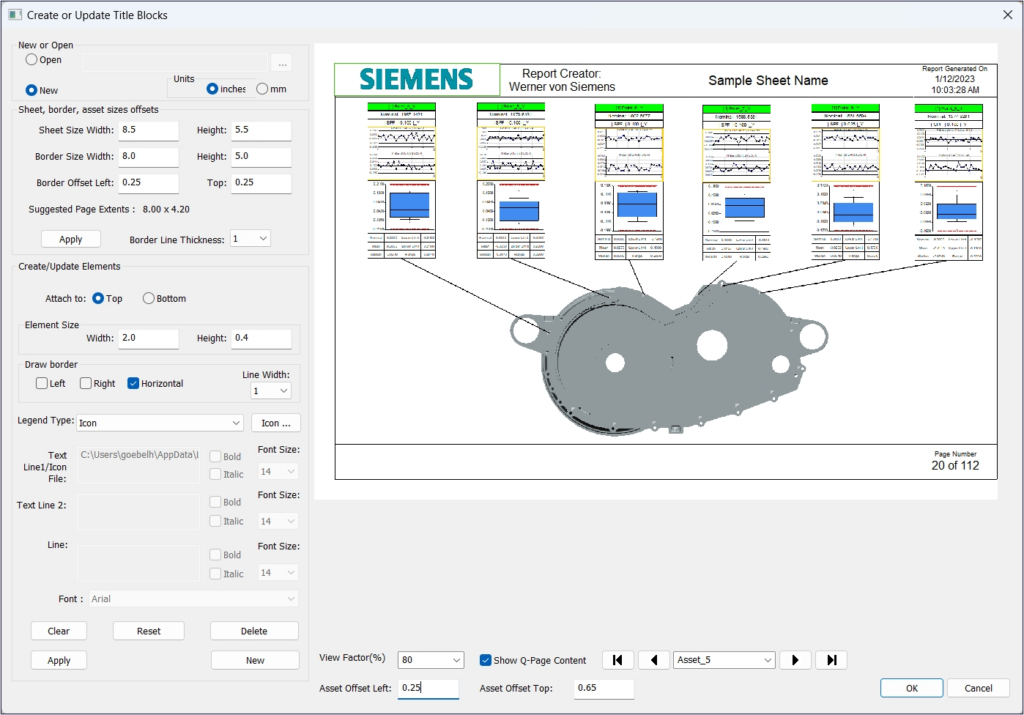
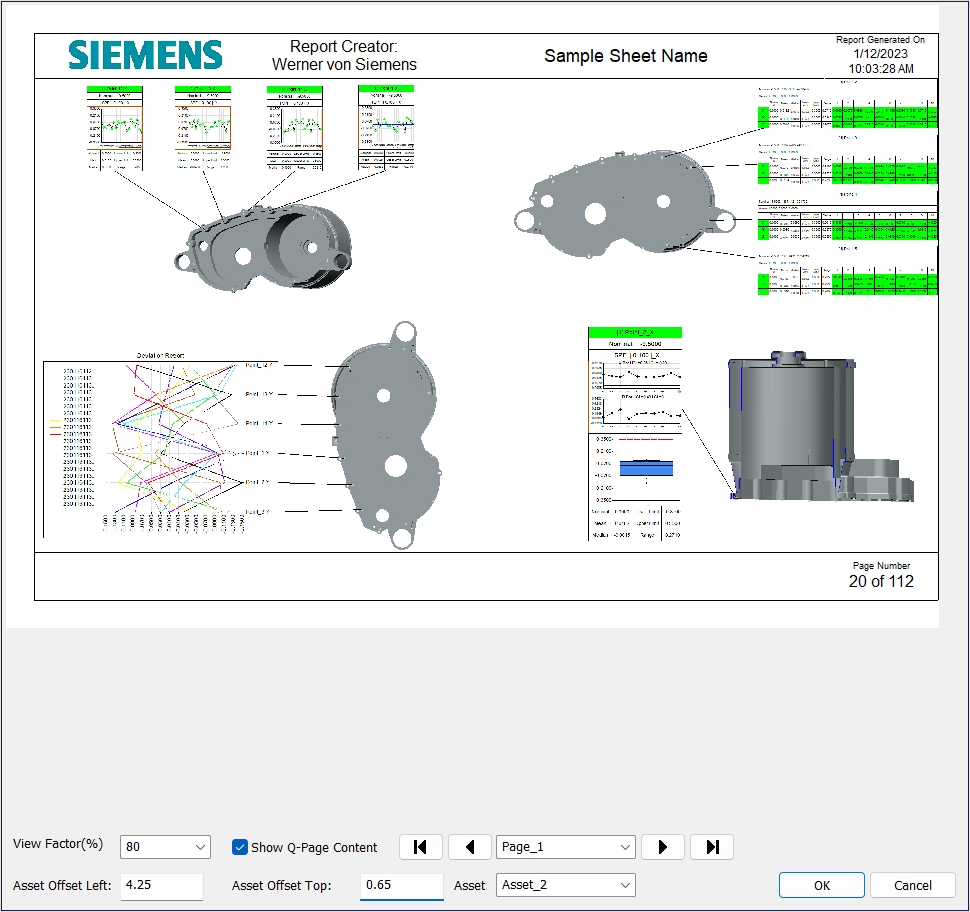
Multiple assets in a Q-Page
Within a Q-Book you can select specific Q-Pages/Assets to be put into a single Q-Page. This allows you to display different geometries or different views of a geometry within a single Q-Page together with different annotations or other information. You can add assets to a Q-Page, remove assets from a Q-Page, or remove the entire Q-Page while its individual assets become Q-Pages again.
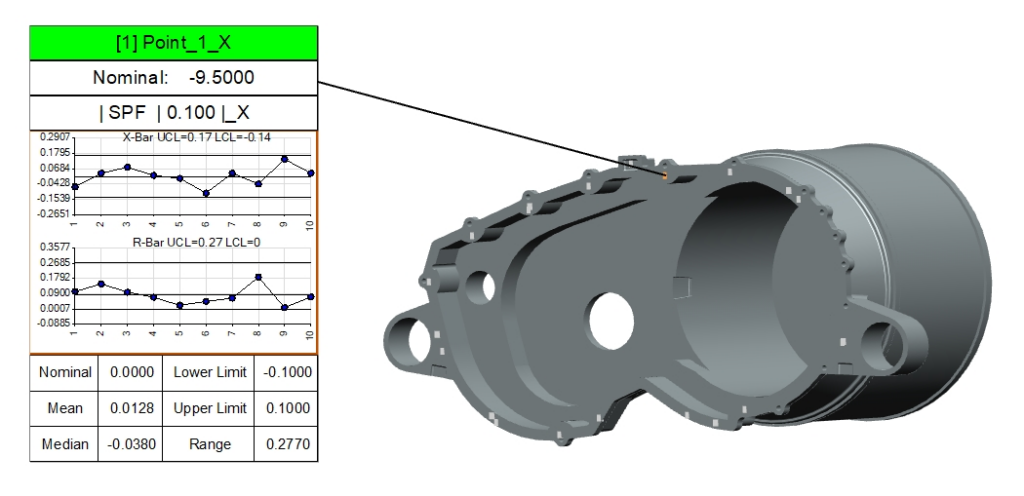
X-bar, R-bar charts
In statistical process control, you can use X-bar and R-bar charts, popularly known as control charts, to monitor the mean and range of normally distributed variables simultaneously when samples are collected at regular intervals from a business or industrial process. You now can add these charts to Q-Book pages and graphical reporting templates.
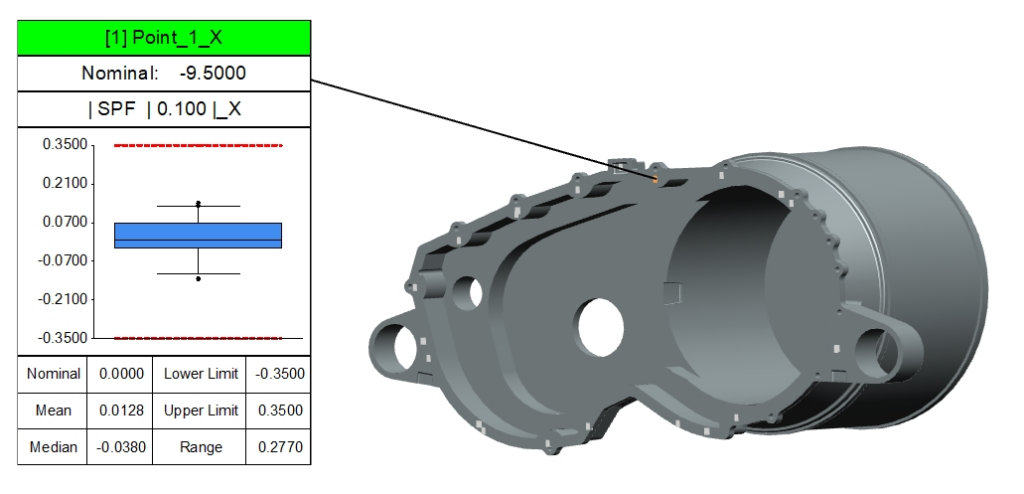
Box and whisker chart
In descriptive statistics, a box plot is a method for graphically presenting the locality, spread and skewness groups of numerical data through their quartiles. In addition to the box on a box plot, there can be lines, called whiskers, extending from the box indicating variability outside the upper and lower quartiles. Thus, the plot is also known as the box-and-whisker plot and the box-and-whisker diagram.
You now can plot outliers that differ significantly from the rest of the dataset as individual points beyond the whiskers on the box plot.
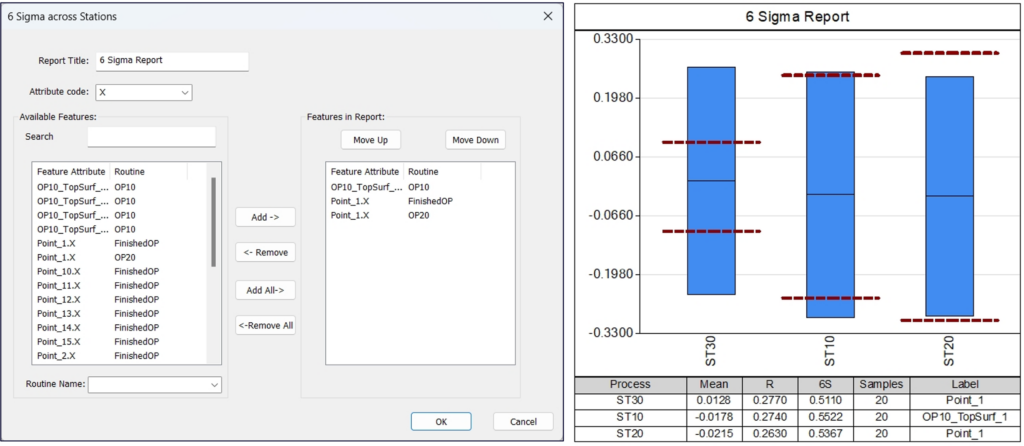
Six Sigma report across stations
The 6 Sigma report across stations allows you to compare the 6 Sigma distribution of the same feature measured in different stations and with different specification limits defined per station.
To create a 6 Sigma report across stations, you must use a merged result set based on different routines/stations.
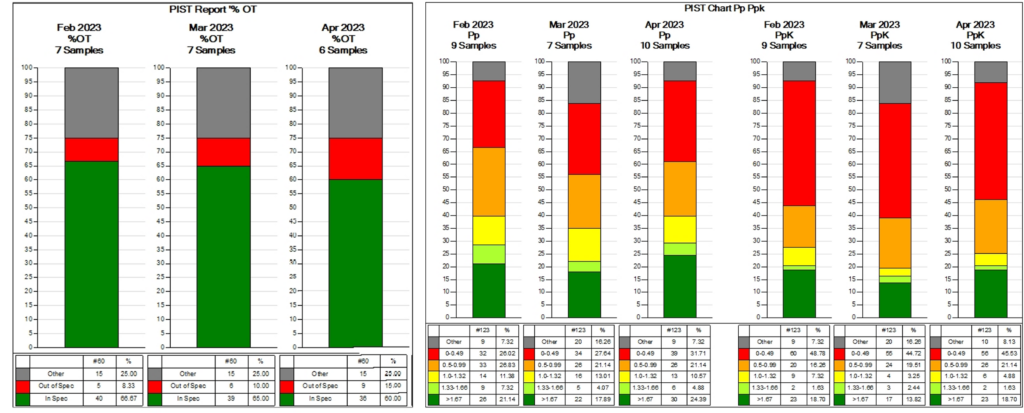
PIST by %OT and Pp/Ppk
Newly added reports help you with Percentage of Inspection points that are Satisfying Tolerance (PIST). You can report the number of satisfying inspections using percentage on target (%OT) and Pp/Ppk. These reports can support you in prototype vehicle evaluations and supplier evaluations.
DPV rule set
You now can create and release a DPV rule set using the Active Workspace client. You can use the default DPV rule set to ensure that the guidelines are followed for the feature data in a DPV MS-Excel engineering workbook.
The rules help validate the data for feature name, feature id, numeric fields, consistency of data between worksheets, required fields and required columns for a specification worksheet. Considering the business requirement, you might want to use the custom set of rules in addition to the default set.

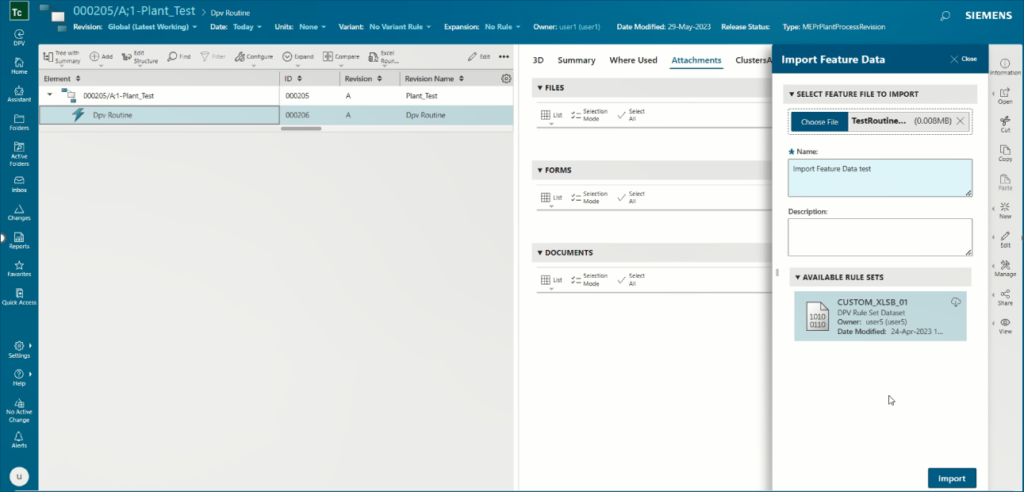
Import feature data
Active Workspace provides you with the user interface to attach design data in XML format to an inspection operation and apply either a default or customer rule set. After you import the XML file, Teamcenter converts the feature data into a DPV MS-Excel dataset to store the data in the DPV MS-Excel engineering format.
CMM inspection programming with NX
NX CMM Inspection Programming software automates the inspection programming process by reading 3D part geometry and associated product and manufacturing information (PMI) attached to the CAD model, identifying defined features and tolerances and creating the operations to inspect the part. In cases where parts have accessible PMI data in the model, applying this link to PMI can save up to 90% of the traditional programming time required.
See more about the new capabilities available in NX CMM Inspection for NX 2306 in the What’s new in NX for Manufacturing blog.
Manufacturing resource library (MRL) and CAM data management
The Manufacturing Resource Library (MRL) and CAM data management can manage manufacturing resources like cutting tools, fixtures and measuring devices used in manufacturing. The system helps you select tool components using a guided search to rapidly create a 3D assembly. The assembled tool can be used for toolpath creation and collision validation in NX CAM and NX CMM Inspection Programming applications.
See more about the new capabilities available in MRL and CAM data management for NX 2306 and Teamcenter 14.3 in the What’s new in NX for Manufacturing blog.
Summary
These are just highlights of the advancements delivered with the latest model-based quality releases. For complete details on the new features of MBQ and its supporting releases, please refer to the release notes and new features presentations offered with the software downloads.
Since this is the first time that we are offering a feature update here in the blog, we invite you to take a stroll with us down memory lane to get you caught up on what has been happening with our model-based quality products going back several versions by reading this community knowledge article containing a summary presentation by John Zhang.
And, as always, hop on over to the public community and website for all things MBQ.
Yours in digital manufacturing and model-based quality,

(On behalf of the entire MBQ product team)

![Reshaping the world with digital manufacturing [VIDEO]](https://blogs.sw.siemens.com/wp-content/uploads/sites/7/2024/07/Zvi_2024_2-395x222.png)