Grill Masters – Unveiling the secrets with CFD

A grill that is too hot or too cold will be a thing of the past when you cook with Simcenter FLOEFD. Let us see if we can find out how grill masters cook.
In pursuit of the perfect grill master
Almost all of us cook something on the grill ranging from meat to vegetables. Grill masters take a long time to become experts and that is for a very good reason. Every grill has unique characteristics such as shape, materials, coal placement, etc. Even the type of coal being used can drastically change grill performance from cook to cook.
The type of grill we will look at is a typical kettle grill. It has vents on the bottom for variable air flow, vents on the top to let hot air escape and the coal is placed close to the bottom vents. A few factors that are very important when trying to achieve a perfectly cooked meal are even distribution of heat which will lead to even cooking, a good sear without burning the food. Grill masters go to various lengths in the pursuit of perfection, some even have secrets that they never willingly share. Using computational fluid dynamics (CFD) simulation with the help of Simcenter FLOEFD we will look at the performance of a kettle grill. Let us see if we can reveal some of the secrets that grill masters hold so dear.
The basics of a kettle grill
Let us breakdown the construction of a typical kettle grill (see Figure 1):
- Top lid – This lid is typically made of steel and coated with paint. This lid also has a plastic handle to safely lift the lid.
- Bottom kettle – This part has similar construction as the top lid. It has flanges for placing the coal racks and the cooking rack.
- Ash catcher – Some kettle grills can hold ash when the bottom vent handle is slid back and forth.
- Bottom vents – These vents allow cold air to enter in order to provide enough air for the coals to burn.
- Coal rack – This is typically placed right above the bottom vent holes.
- Cooking rack – This is placed above the coal rack.
- Top vent holes – The hot air leaves the grill from these holes. These gases are combustion products from burning the coal.
- Temperature probe – This probe is typically used to judge how hot the grill is.

A few observations can be made after looking at this particular design. The temperature probe is placed all the way at the top of the grill. There could be a difference in temperature inside the grill which cannot be captured. Some parts of the grill may be hotter or cooler than the location of the temperature probe. The placement of the bottom vents and the top vents may also have an impact on the performance of the grill. Other factors causing variability in performance of the grill are:
- Amount of food on the grill at any one time
- Placement of food
- Amount of charcoal
- Placement of charcoal
Let’s use CFD to cook like grill masters
For this study, we are using a uniform distribution of charcoal on the rack, grill masters take this very seriously. As a first step we need to find the temperature at which charcoal burns. Abhishek Vanaparti with Auburn University published a paper [1] characterizing two types of coal (instant light vs. slow burning). The temperature of charcoal for our study is obtained from this paper. The temperature measurement is done when the charcoal reached a gray condition. Typically charcoal is presumed ready for use when it turns gray. Also, we assume that the charcoal maintains temperature for the duration of our experiment.
The next assumption related to the type of food being put on the grill. Since meat is made up of several different kinds of tissues and fibers, characterizing the material properties is a daunting task. For simplicity, one value of density, specific heat, and thermal conductivity has been selected to mimic the properties of chicken. Special attention is paid to the emissivity value of the metallic components of this grill. The color of the top and bottom kettle is assumed to be black. All metallic parts are assumed to be made of steel.
The grill is placed in an open environment at an ambient temperature of 68F. The physics being considered are heat conduction in solids, radiation, and gravity. Radiation played a big role in this study as a significant amount of heat leaves charcoal in the form of radiation.
The analysis is split into two steps, grill preheating and the cooking stage. This is done to mimic the way which food is typically prepared on the grill.
Results and findings
Flow trajectories inside the grill:
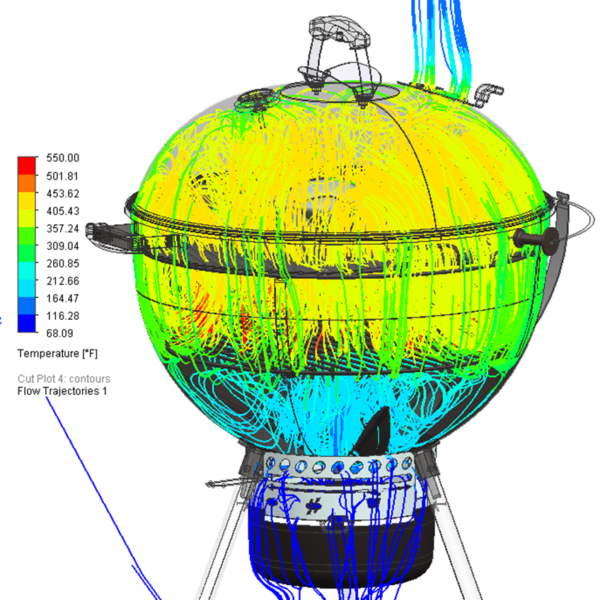
To better understand the distribution of flow inside the kettle let’s look at cut plots and flow trajectories showing how air is moving within the grill.
By looking at the flow trajectories(see Figure 2) we can see that cold air enters at the bottom and circulates near the coal rack region. There is also a huge re-circulation zone formed by the top cover of the kettle. This is a great design feature as more re circulation results in more even temperature distribution inside the kettle. To get a better idea about the flow let’s look at velocity cut plots.
Temperature cut plots inside the grill:
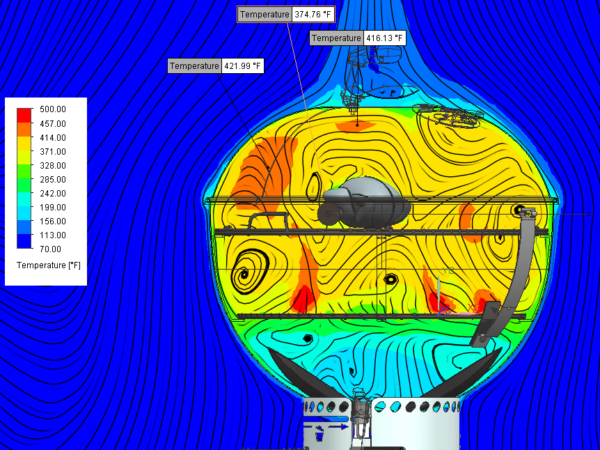
The image below(see Figure 3) shows the center of the grill while avoiding both vents. In the section below there is no air leaving or entering from the vents. The temperature distribution is quite uniform. We also see a few localized hot spots and they are about 45F higher than temperature near the chicken. This difference could become a significant factor if the food is cooked for a long time.
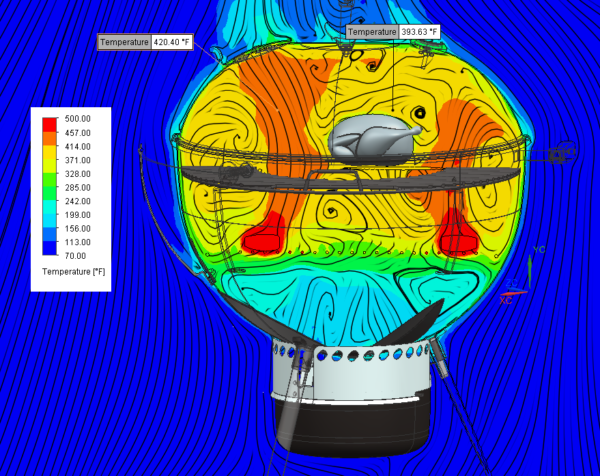
The image below(see Figure 4) shows a section taken at one of the vents. We clearly see that distribution in this section is not very uniform. There are a few things that contribute to this, the bottom vents are placed directly below a few coal pieces. More importantly, the top vent and the bottom vents line up, so, air can enter the bottom vent and leave through the top vent without circulating inside. This is the reason we have a large hot spot starting near the coal and going all the way to the top vent. The left-hand side of this image shows the hot air leaving the grill while on the right-hand side there is still re-circulation.
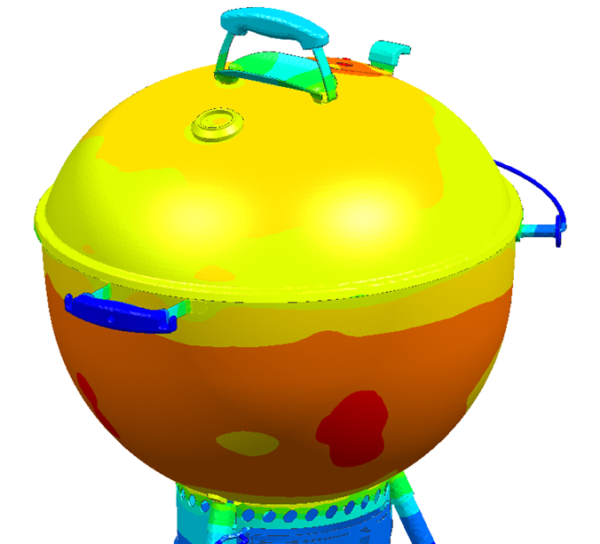
Temperature distribution on the outside surface of the grill:
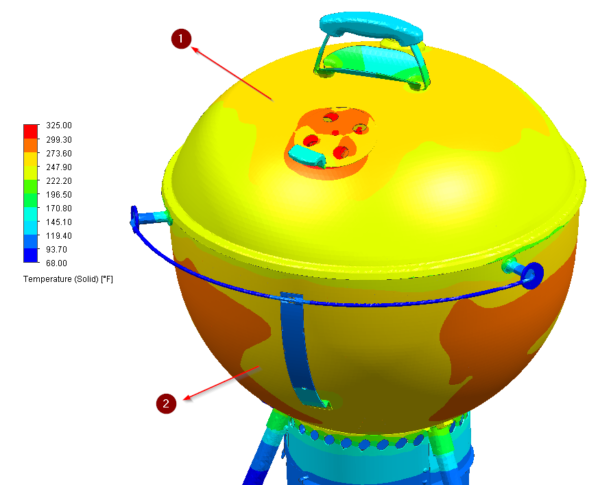
While looking at the image below(see Figure 6) we can see that the temperature distribution on the outer surface is not uniform. Hot air leaves through the top vents (see Figure 6 bubble 1) and we can clearly see that region at a higher temperature. As you can see, the lower vents are lined up with the top vents, so, when we look at that side of the grill, we see lower temperatures than the surrounding areas. This could be due to lack of re-circulation or due to heat being dissipated via the metallic attachment (see Figure 6 bubble 2) that is designed to hold the lid while opening the grill. The other side of the grill is shown below (Figure 7) with the temperature probe visible, on this side the temperature distribution on the bottom grill is much more even.
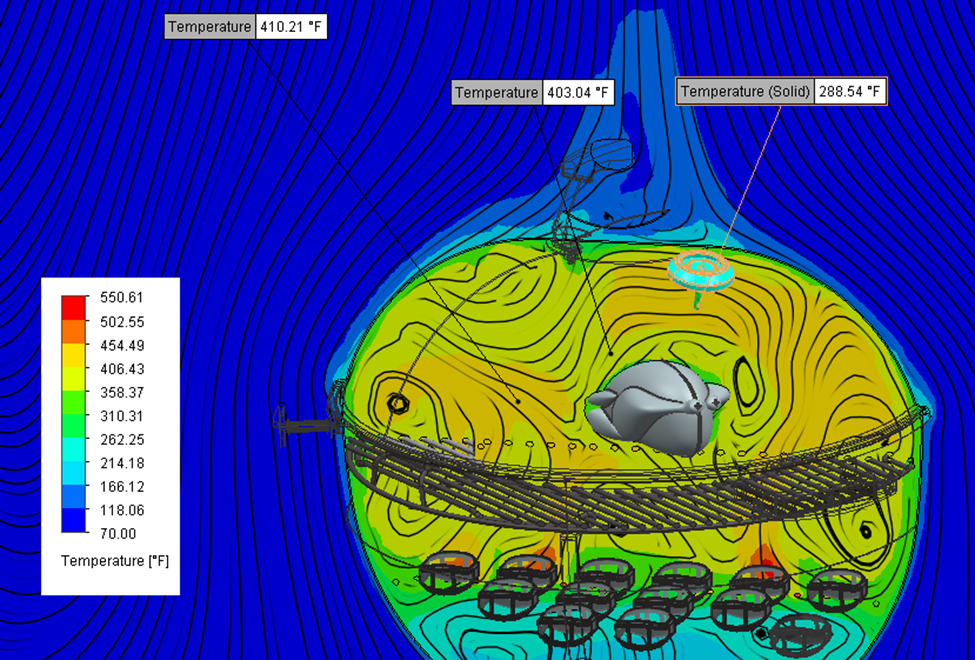
Is the temperature probe a good metric for measuring grill temperature?
The temperature probe is typically used to measure the temperature of the grill. People assume that the average temperature inside the grill is the temperature of the probe. From the image below(see Figure 8) we can see that the probe is at ~290F but the temperature in the top section of the kettle housing the food could be anywhere between 400-410F. This is more than a 100F difference in the measured vs the actual temperature.
Next steps and summary
CFD has been very helpful in understanding what’s actually happening inside our grill. Valuable information can be extracted from these results without having to do physical testing quickly and without having to consume under-cooked or burned chicken. In fact, these simulations offer a more in-depth analysis of the grill performance than what can be achieved through physical testing. With Simcenter FLOEFD engineers could even perform intelligent design exploration on existing designs to improve the performance directly and inside their CAD system. Various things like geometry, boundary conditions and constraints can be changed and things like temperature in certain regions, flow velocities in keys areas, etc., can be optimized. Hopefully this CFD study has given some insight on what grill masters learn from years of experience.
Some of the conclusions and possible next steps for this grill are as follows:
Temperature distribution inside the kettle is fairly uniform but there are some hot spots with higher that 40F difference than the surroundings. Even temperature distribution is desired in all regions of the grill. The placement of the top vents relative to the bottom vents could be responsible for this issue. Design exploration can be performed in order to vary the orientation of these vents to find the best arrangement of the vents.
There was some uneven temperature distribution on the outer surface of the lower kettle. This could be due to hot air escaping or the metallic attachments. Further work needs to be done to identify the cause of this temperature difference.
The temperature probe shows more than 100F lower temperature than some regions in the grill, it is possible that grill masters already have an understanding of this. A better approach would be to conduct multiple studies and find out a correction factor that can be applied to solve this discrepancy. Multiple temperature probes could also be used in order to get a better idea of the temperature distribution inside the grill.
[1] Abhishek Vanaparti (2016), Experimental Study of Radiative Properties of Charcoal Combustion in Grills
If you’re interested in finding out more about how CFD can help you understand airflow in another cooking technique … in this case, an oven, take a look at this on-demand web seminar on Simulating and Optimizing Flow Fields!


Comments
Comments are closed.