Simcenter Femap 2506 – Aeroelastic solution enhancements
Modern aircraft are pushing the boundaries of design with lighter materials, more flexible structures, and complex active control systems. Although this innovation offers significant improvements in performance, it also amplifies the critical importance of aeroelasticity – the intricate interaction between aerodynamic forces, structural flexibility, and inertial forces. Unchecked aeroelastic phenomena like flutter, divergence, or control reversal can have catastrophic consequences.
At Siemens Digital Industries Software, we are committed to empowering engineers with the most advanced tools to tackle these challenges. Following the strategic acquisition of Zona Technology, we’ve integrated world-class aeroelastic capabilities into Simcenter Femap 2506.
Simcenter Zona ZAERO – A new graphical workflow
Before version 2506, the ZAERO process was primarily text input file based. The updated workflow enables users to create and modify both the structure and the aeroelastic model within the Simcenter Femap interface.

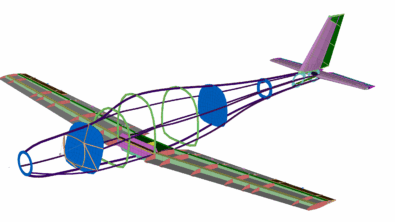
Simcenter Zona ZAERO utilises input “cards” to define both the aeroelastic model and its interface with the structural model, similar to Simcenter Nastran. The workflow includes creating the structural model, specifying aero panels, airfoil sections if required, and aero bodies. Aero components are connected to the structural model through aero splines. The Zona Aeroelasticity feature is accessible from a recently introduced menu located below the Nastran Aeroelasticity commands.

ZAERO panel
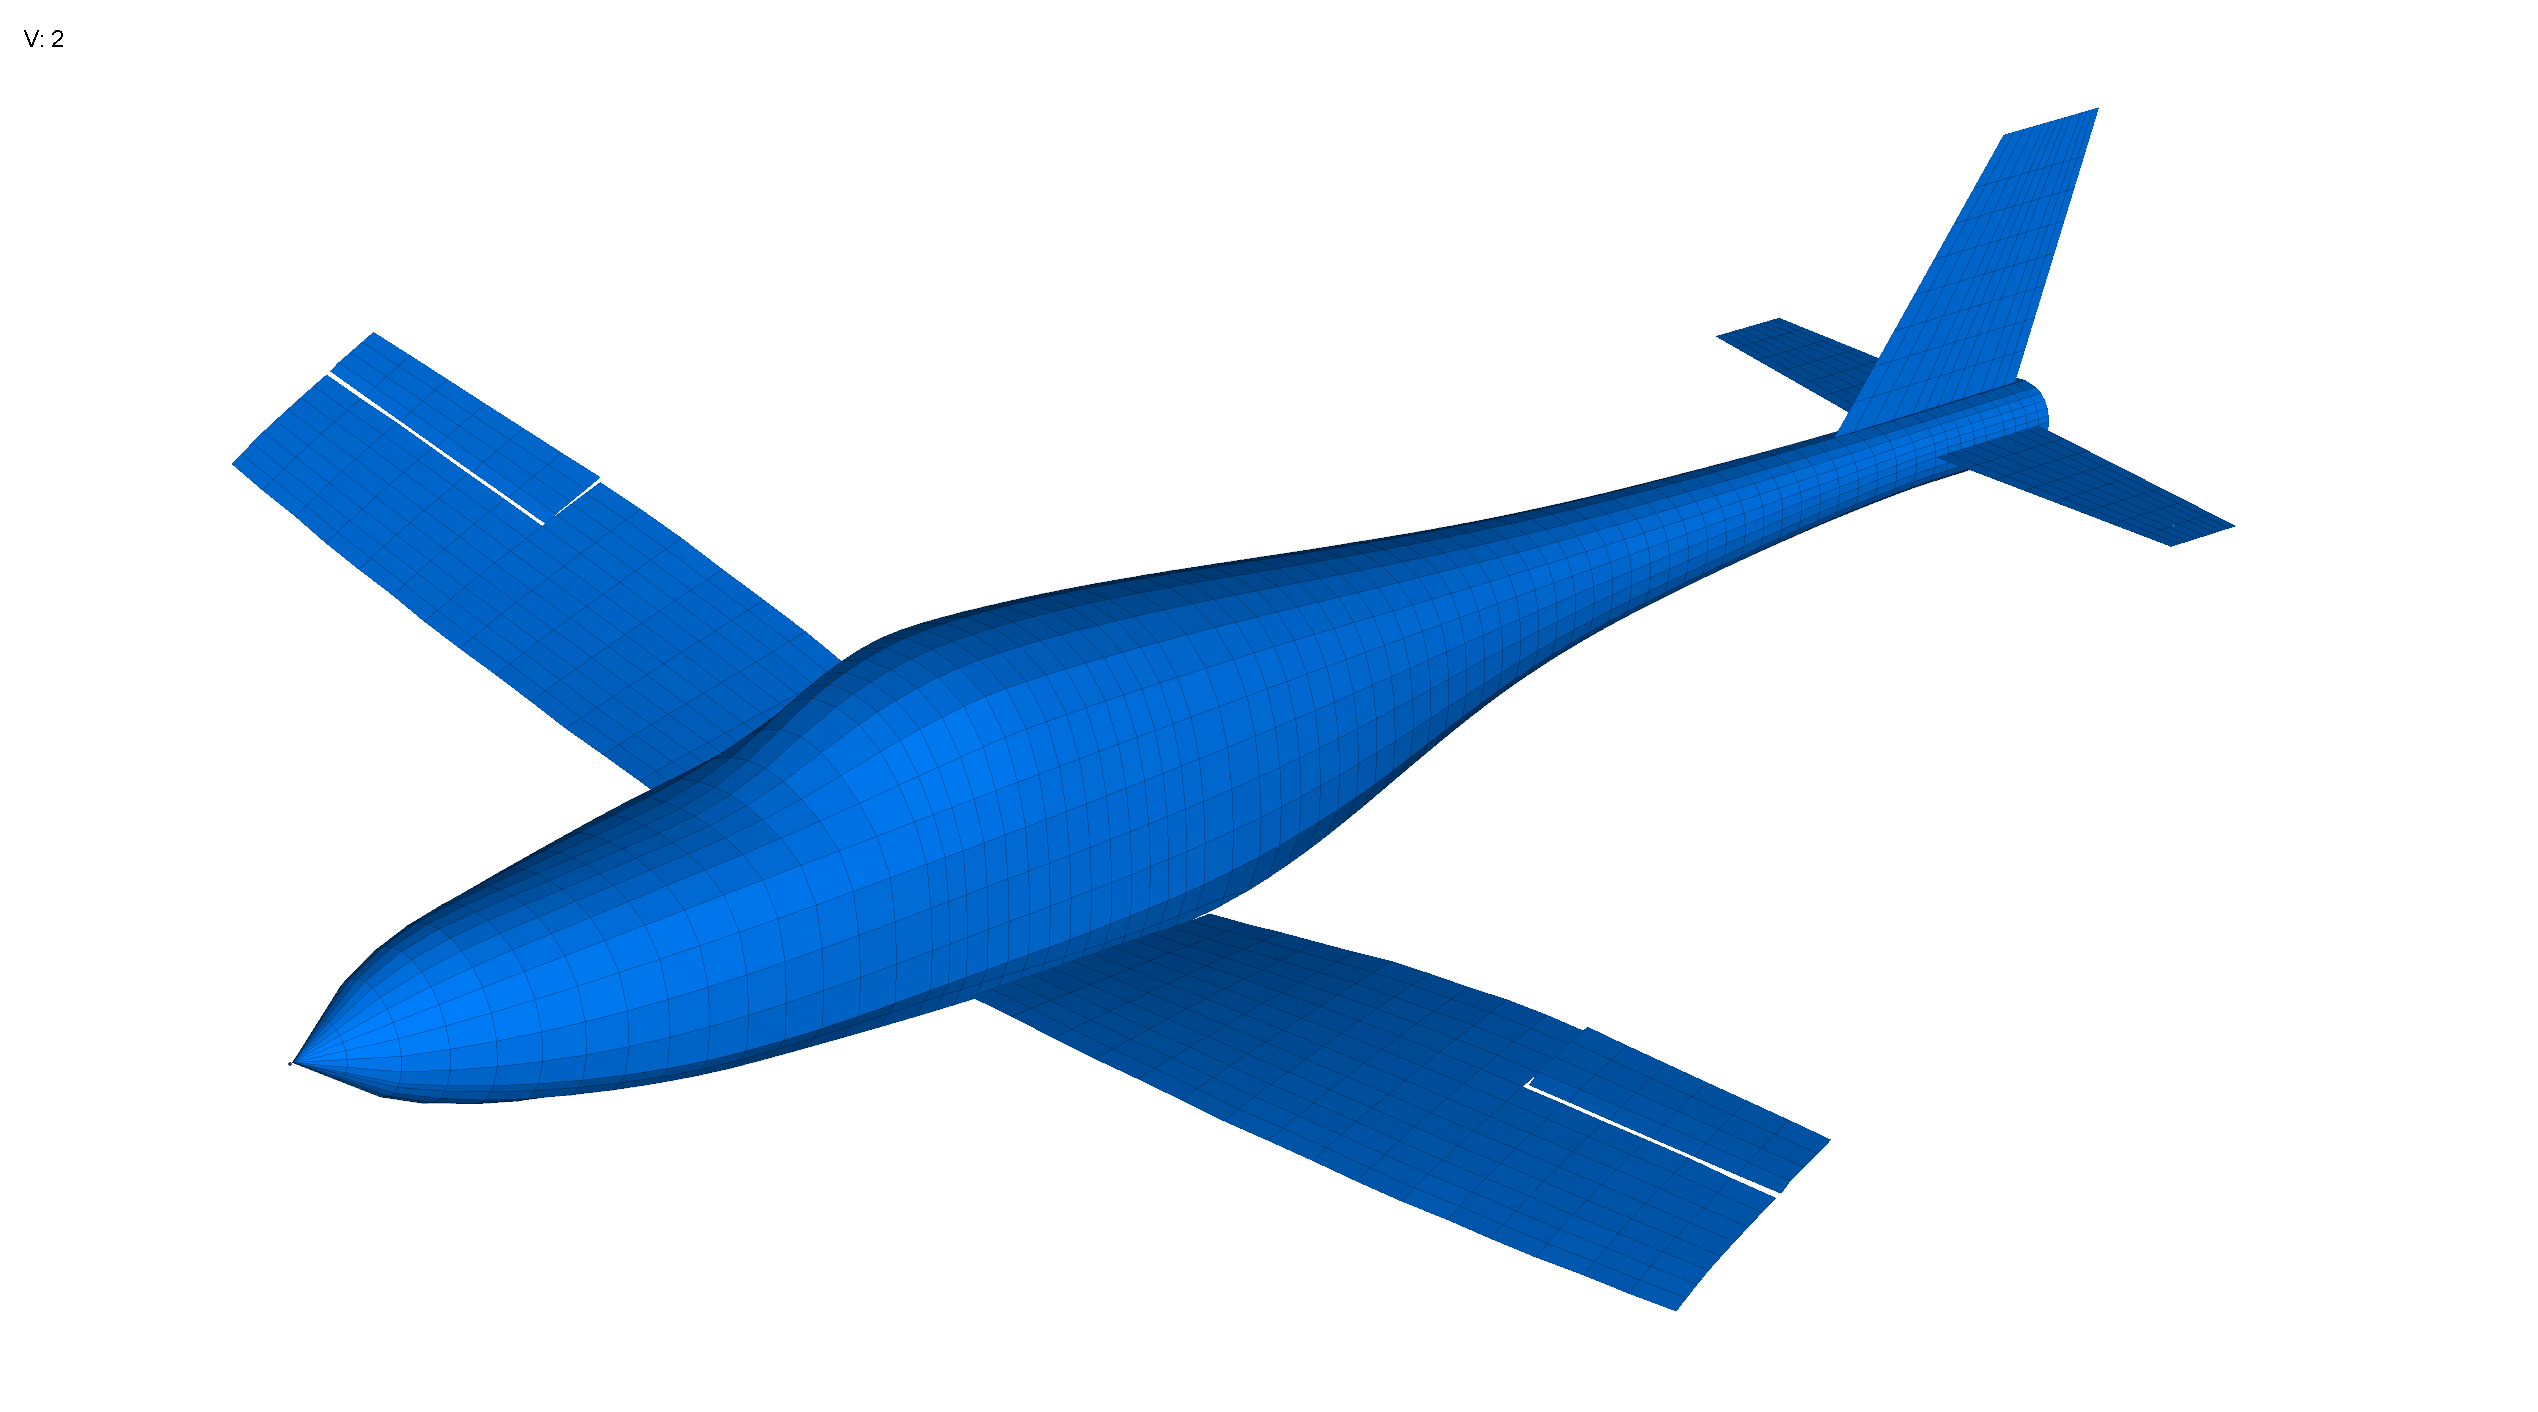
A Panel specifies the principal aerodynamic surfaces of the structure, including the wing, rudder, and elevator. Surfaces may be defined by inputting coordinates or selecting points from the structural geometry. Mesh size is managed via the Chord Divisions and Span Divisions settings. Additionally, when the analysis incorporates bodies such as the fuselage, the attachment point is designated at this stage. In the present example, the wing root is affixed to the fuselage body.

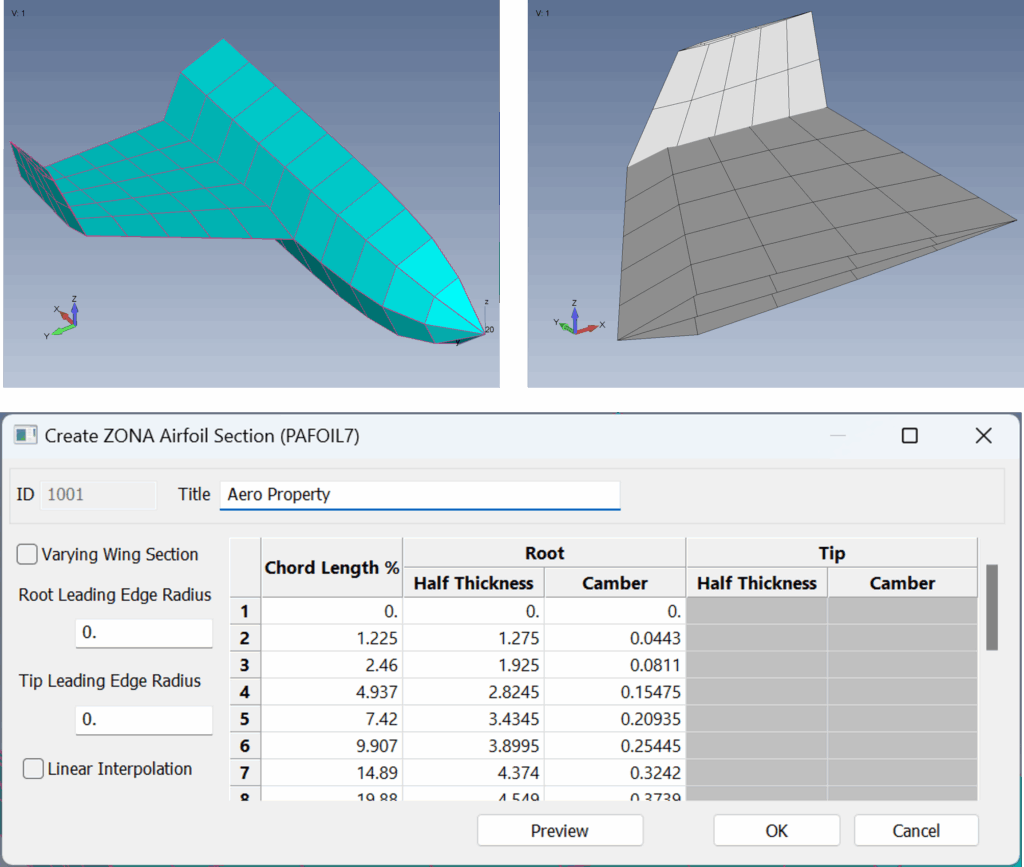
ZAERO section
Airfoil Section assigns airfoil profiles to these surfaces, facilitating more detailed analysis and higher fidelity results.
- Dynamically display panels with aero thickness
- Excel like functionality to enter data directly into cells
- Option to have different root/tip section
- Preview button to show 2D plot of section data
ZAERO spline
Aero Splines connect the structural mesh to the aeroelastic mesh. It’s a simple connection from specific “boxes” or an entire CAERO7 to nodes from the structural model. Nodes can be picked manually with all the node selection options, or from a FEMAP group.

Output tables for post-processing
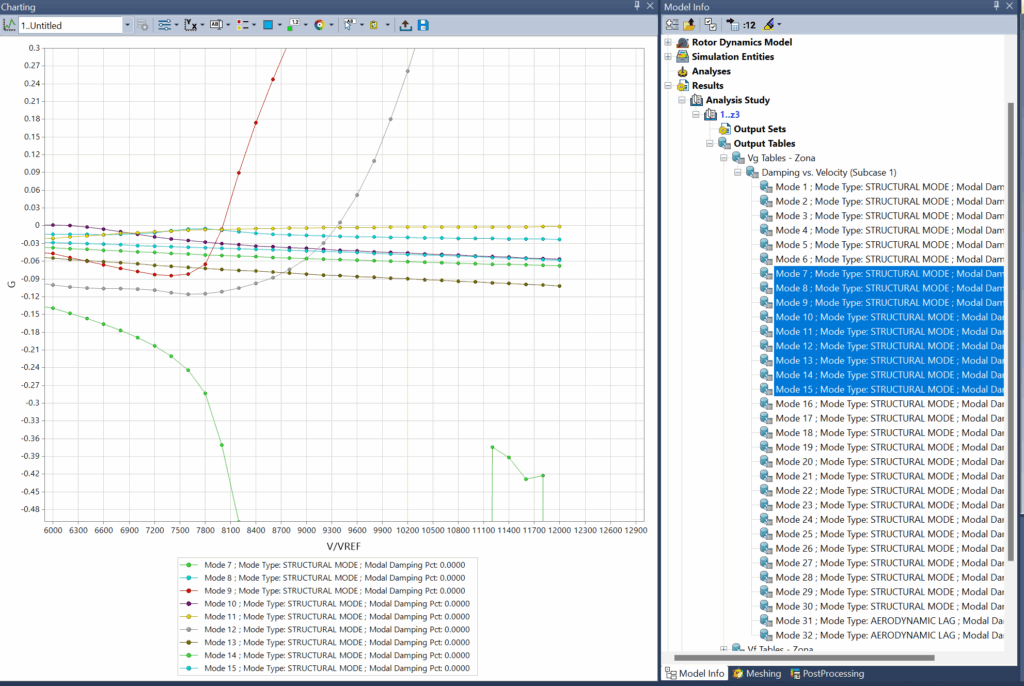
The introduction of ZONA ZAERO Post-Processing functionality required a revised approach to managing tabular output data. In earlier versions of FEMAP, tabular results were stored within FEMAP functions, which are suitable for handling simple X, Y pairs of data. However, combining input functions and output results in the same location created potential confusion. As a result, FEMAP functions will be designated as Pre-Processing items, while Output Tables will serve as Post-Processing items. The FEMAP development team opted to retain Functions for input operations, while implementing the new Output Tables as a dedicated format for storing solver results.

With their metadata, Output Tables know where they came from, we can now customize charting to leverage this, and even tabular listings to present the data more clearly.
Interpreting flutter analysis
In flutter analysis, velocity vs. damping ratio graphs help engineers identify the critical flutter point where a structure’s damping becomes zero or negative. These graphs show how a structure’s stability changes as airspeed increases, revealing the transition from stable to unstable regions.
When examining these graphs:
- Negative damping indicates stable conditions where vibrations naturally decay
- Zero damping represents the flutter boundary (neutral stability)
- Positive damping indicates unstable regions where vibrations amplify without external energy
These plots are crucial because they help engineers determine the flutter speed – the speed at which a structure becomes unstable.
The V-g-ω (velocity-damping-frequency) plots show how damping changes with airspeed for different vibration modes, helping identify which specific structural modes might lead to flutter issues and allowing engineers to implement targeted design modifications to improve aeroelastic stability before physical testing.
Thank you so much for your attention and time. Your feedback is incredibly valuable to me, so please feel free to share your thoughts and suggestions in the comments below.
Simcenter Femap community
Connect with other Simcenter Femap users, share experiences, and ask product questions in the Simcenter Femap community.


Comments
Leave a Reply
You must be logged in to post a comment.
Mastering the intricate balance of aeroelasticity is a massive engineering challenge, especially as wings become lighter and more flexible. I spent my morning running flutter simulations and the sheer precision required to prevent structural failure is enough to keep any designer on edge. During a quick break from all the aerodynamic modeling and stress testing in my office, I found spinania , which has some solid offers for players in Spain. A few rounds of Gates of Olympus provided the smooth, visual reset I needed. It’s a great way to clear your head before diving back into your flight control systems.
Μόλις είχα βάλει το κλειδί στην πόρτα για να φύγω για τη δουλειά και ξαφνικά θυμήθηκα ότι είχα ξεχάσει να βάλω φορτιστή στο τηλέφωνο. Άνοιξα το gold zino ενώ περίμενα να φορτίσει λίγο. Στην αρχή είχα μόνο μικρές ήττες που με έκαναν να νιώθω βιαστικός. Αποφάσισα να ρισκάρω λίγο περισσότερο σε ένα μεγαλύτερο γύρο και ξαφνικά ήρθε ένας δυνατός συνδυασμός που μου έδωσε καλό κέρδος. Οι παίκτες από Ελλάδα έχουν πρόσβαση σε ειδικές προσφορές που κάνουν την εμπειρία ακόμα πιο συμφέρουσα. Τώρα το παίζω όποτε ξεχνάω κάτι σημαντικό και βιάζομαι.