Free app to cut down on coffee (segments)
We may not be able to help you with cutting down your coffee consumption, but we can definitely help with annotation, ranking and automatic cutting of segments from your NVH operational testing of espresso machines (among other things). Even the most thoroughly prepared measurement campaign can take an unexpected turn. A colleague steps into your anechoic chamber halfway through the test, a truck driver blows his horn during road noise testing, or you suddenly hear something strange during the test and would like to easily go back and listen to it again. The ability to mark such events during a measurement is precisely why we’ve created the Simcenter Testlab Event Marker app, a free Android app for your Simcenter SCADAS XS.
Mark it, rank it and drink it
Where to start? It’s very easy. We will explain it based on a coffee machine NVH (noise vibration harshness) measurement:
- Download the free Simcenter Testlab Event Marker app from Support Center and install it on any Android device, even your phone
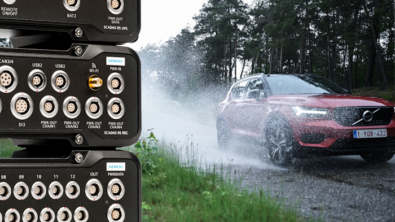
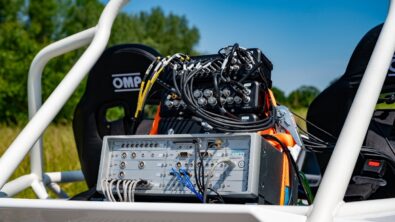
- Grab your Simcenter SCADAS XS
- Define the acquisition template (channels, triggers, etc.) using either Simcenter Testlab or the Simcenter Testlab Scope app
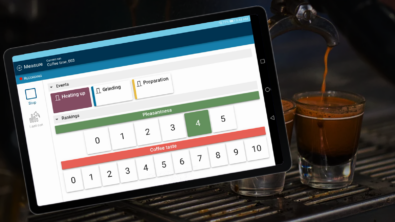
- Start up the Event Marker app, select the acquisition template, and start defining the event template
The event template can consist of two types of buttons:
Event button
Mark important events that have occurred during the measurement, such as an unexpected noise, but also different conditions, that you expect to occur during the measurement. In our case, this could be the machine heating up, bean grinding and coffee preparation. We could also easily extend the template with a simple “NOK” button. This may come in handy if something goes wrong during the test, but you are still planning to continue measuring. Such a marked event is the best way to find back the right timestamp in the measurement and cut it out.
Ranking
Provide your subjective ranking to different, user-definable categories, such as robustness or the feeling of luxury. For our espresso machine testing campaign, we will be rating the pleasantness of the sound and the taste of the coffee. You can clearly see that neither of these categories can be easily measured with an ICP sensor – and that is perfectly fine! Correlating subjective impressions with objectively measured quantities is the cornerstone of sound quality analysis.
Let’s make coffee
In our test, we used the event buttons (Heating up, Grinding and Preparation) to indicate the different phases in the operation of the coffee machine. The rating of pleasantness has been changed as the different operations took place as well. Once the test was complete, the only thing left was to judge the taste of your caffeine beverage.
Does it sound as good as it tastes?
With the measurement and event marking complete, it’s time to take a look at the data. Connect your Simcenter SCADAS XS to the PC via a USB cable and startup Simcenter Testlab. You can import the measurement file directly from within the software, you’ll notice 5 new channels next to the operational NVH data:
Time to cut (some segments)
So we have a long measurement, from which we’d like to extract segments corresponding to the different steps of making a coffee. Ideally, this should happen automatically, since we would have to repeat the same process in the future for other machines. Luckily, Simcenter Testlab Process Designer is there to help. It’s a very flexible post-processing application where you can graphically design the data flow. Here is our process, let’s walk through it step-by-step:
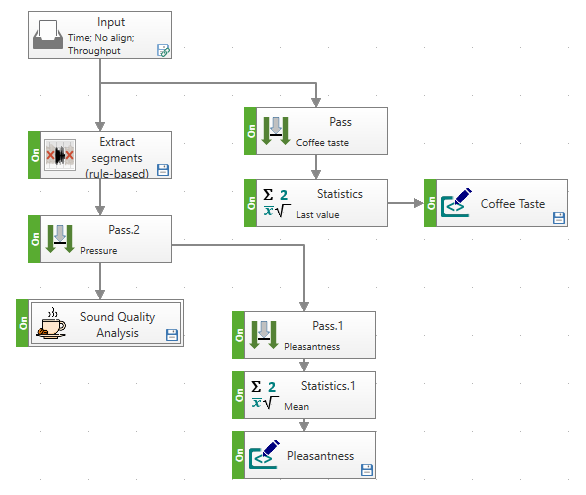
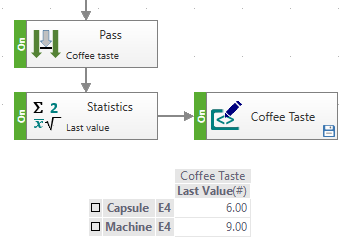
The process always starts at the top with an Input method, that’s where you will gather all of your data. The first branch, shown below, makes a selection of the Coffee taste channel by using the Pass method. We then use the Statistics method to calculate the Last value of that channel (as it’s the last value provided by the user during the ranking) and use Metadata editing to present the final result in a tabular format.
A similar approach is used for the rating of Pleasantness, but instead of calculating the Last value, we’ve used the Mean of that channel instead (since the ranking has been changing as the measurement was progressing).
In the last step, we are going to focus on the automatic segment extraction. The Extract segment (rule-based) method is an extremely easy and powerful way to extract multiple segments through a simple dialog:
Once the segments are cut, the only thing left is to analyze the data. We’ve selected a few sound quality methods (Loudness, Tonality, Roughness and SIL), but decided to hide them behind a combined method for a cleaner process.
The final result is both objective and subjective evaluation of a coffee machine, performed in a highly automatic way, leaving us plenty of time to enjoy a cup ourselves.
Get your free Simcenter Event Marker app today!