Exciting Days
The Incident
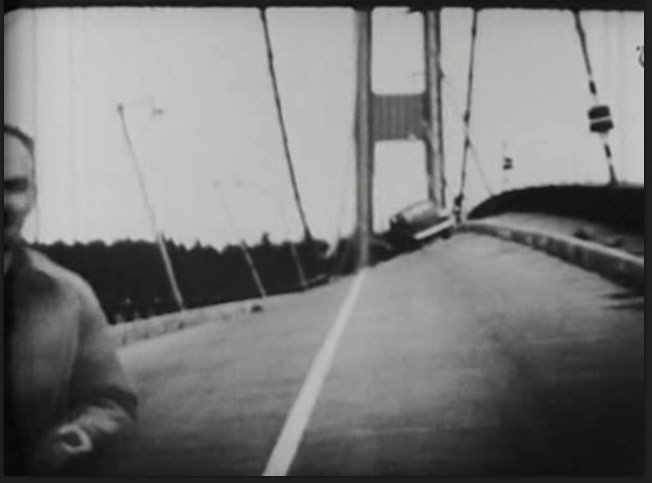
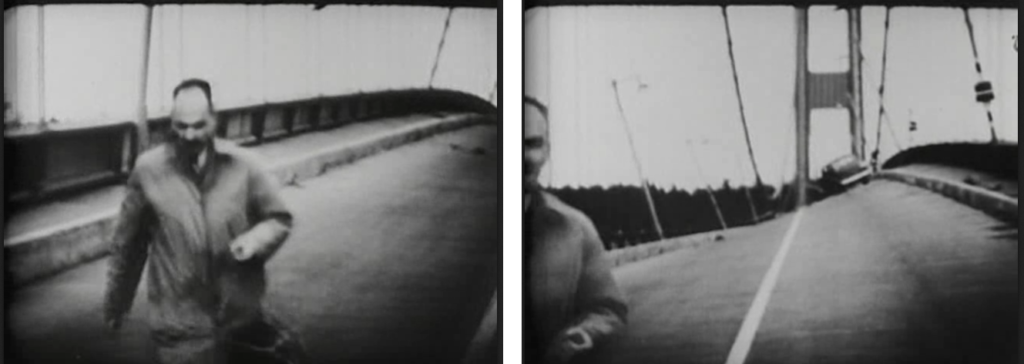
The 7th November 1940 was a particularly bad day to cross the Tacoma Narrow Bridge. At 11:00 am local time the bridge collapsed in a dramatic event. Barney Elliott, owner of a local camera shop recorded the collapse on 16 mm film (Link). My favorite scene is at about 1:40min. Despite heavy swaying a gentleman seems unconcerned and is walking calmly on the bridge! The fact that no one got injured is best described as a miracle. (Source: Wikipedia)
The collapse of the Tacoma Narrows Bridge is a famous incident, and you can find countless articles about it. Far less famous is the collapse of the Ferry Bridge Cooling Towers (UK) on the 1st November 1965.
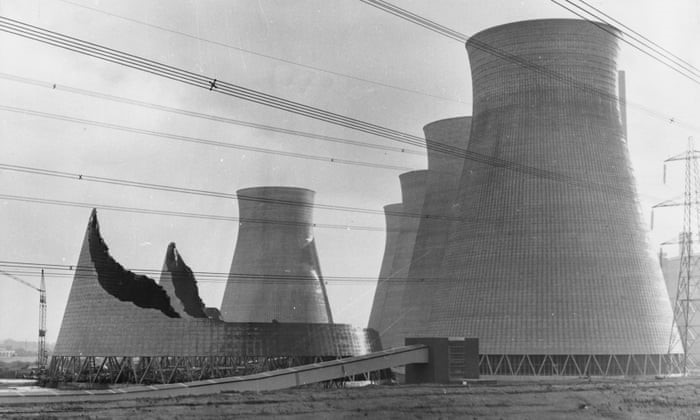
What happened? In both cases wind excited eigenmodes of the structures. A positive feedback between the structure vibration and the flow led to ever growing amplitudes, and ultimately to the collapse of the structures. In short, Flutter. Without the positive feedback loop the amplitudes would have remained constant, a phenomenon far less dangerous and known as Limit-Cycle Oscillations (LCO).
The Challenge
Both, flutter and LCO fall into the category of Fluid-Structure Interaction (FSI) behavior and both are examples of two–way coupled physics. The deformation of the structure impacts the flow, and the flow pressure impacts the structure. Unfortunately, two-way coupled FSI problems are particularly difficult to study because the solution in one domain depends on the solution in the other domain and vice versa.
Let’s travel back in time to the design process of the Tacoma Narrow Bridge. Let’s further assume we are fully aware that we have to consider flutter. It is around 1935, and pretty much all we can do is to build a model. The model has to represent the surface of the bridge accurately, which is doable even in 1935. But at the same time the model must have the exact eigenmodes and eigenfrequencies of the real bridge. In short, we have to get the entire mass distribution and stiffness right. But not only that, our model has to fit into the wind tunnel, and we have to scale the operating conditions with respect to our model size. All together an extremely challenging task, to say the least.
The Value of Simulation
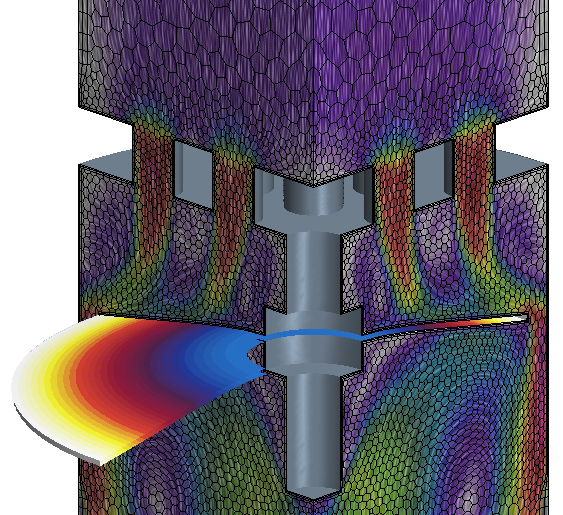
Today we are no longer limited to experiments. With Simcenter STAR-CCM+ and Simcenter 3D it is straight forward to build accurate flow and structure simulation models. Not only that, the Simcenter Nastran to Simcenter STAR-CCM+ Co-Simulation allows us now to couple both models together. In short, the co-simulation executes the following operations automatically:
- The flow pressure is computed and send to the structure model
- The resulting deformation is computed and send back to the flow model
- The flow domain is updated accordingly
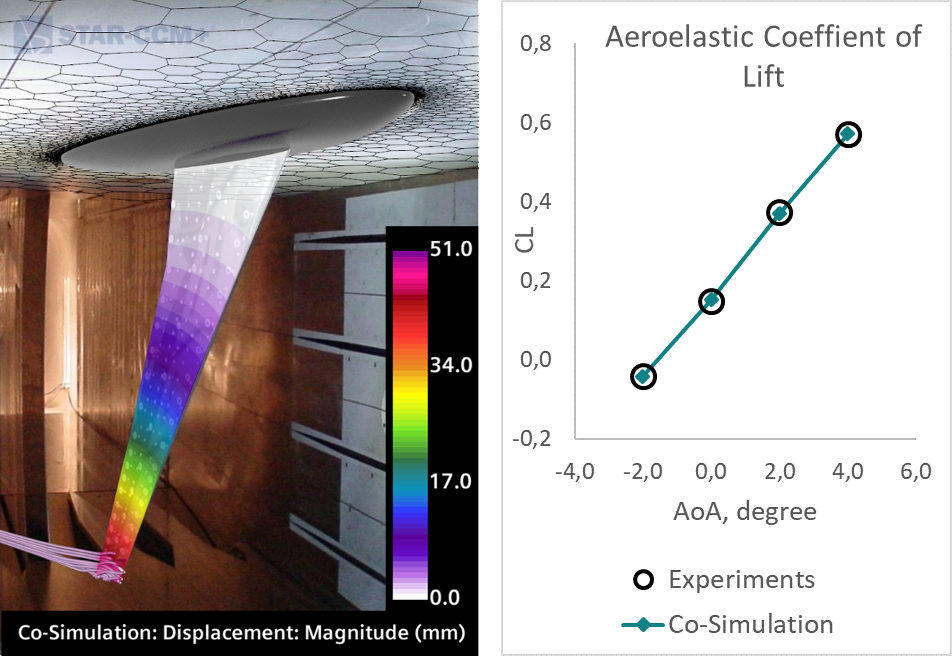
The co-simulation has been validated with the High Reynolds Number Aerostructural Dynamics (HIRENSAD) wind tunnel configuration of the 1st Aeroelastic Prediction Workshop. In the experiments reported in Ref. 1 the flow deforms the wing into a state of Static Aeroelastic Equilibrium. For the deformed wing lift and drag are report for different angles of attack. As you can see, the simulation results are in excellent agreement with the experimental data.
FSI – An Experience
If you grow up close to a creek you may have played in the cold water during a hot summer day. Did you ever put a stick upright in the current and noticed that it starts to vibrate? I was recently reminded of such a childhood memory. I was standing hip deep in a river with heavy current, fishing for trout, and I was at the edge of loosing my balance. Suddenly my wading pole started to vibrate heavily.
What an exciting day! All the hours spend studying fluid and structure mechanics at the university would finally pay off! I knew the solution to my problem. It was as simple as changing the natural frequency of my pole, and all I had to do was to put more or less body weight on it. The change in tension (here compression) changed the frequency in the same way as tensioning a guitar string changes the tone.
For a little while I was happy, but then I realized that my situation had not improved. I was still standing in the middle of the river. I tried to comfort myself thinking that at least it was not the 7th November 1940 and I was not standing on a bridge.
Recommended reading & references:
Simcenter STAR-CCM+ Documentation: Tutorials > Coupling with CAE Codes > Simcenter Nastran Co-Simulation: Disc Valve
Ref. 1: Ballmann, J., Dafnis, A., Korsch, H., Buxel, C., Reimerdes, H.-G., Brakhage, K.-H., Olivier, H., Braun, C., Baars, A., and Boucke, A. Experimental Analysis of High Reynolds Number Aero-Structural Dynamics in ETW, AIAA 2008-841, Presented at the 46th AIAA Aerospace Sciences Meeting and Exhibit, Reno, NV, January 7-10, 2008.
Comments
Comments are closed.


Nice to see this is finally available!
That is great to see, indeed exciting days!