Evaluate the energetic performance of a Fuel Cell Electric Vehicle with system simulation
Discover the interest of multi-domain system simulation model of a Fuel Cell Electric Vehicle to predict interactions between the vehicle powertrain, the fuel cell and its auxiliaries as well as the controls.
Purpose
In the trend of zero-emission vehicles, OEMs are considering fuel cells as a valid complement to batteries, especially for vehicles requiring a long-range without repeatedly recharging.
However, integrating the stack and the Balance of Plant (BoP) into a vehicle is not straightforward. It involves many interacting physics and subsystems that need to be perfectly combined with optimal control strategies. So as to reach the required levels of performance, the lowest energy consumption while ensuring strong reliability and longevity.
That’s why a multi-physics system simulation-based approach helps to predict and better understand the behavior of the fuel cell integrated with its air and hydrogen supply systems, as well as the water and thermal management systems.
A new ready-to-use templates model has been developed in Simcenter Amesim 2022.1. It integrates the classical components and subsystems of recent Fuel Cell Electric Vehicles such as the Toyota Mirai or the Hyundai Nexo.
The model includes the following subsystems:
- the vehicle environment and the electric motor,
- the electrical network and the battery,
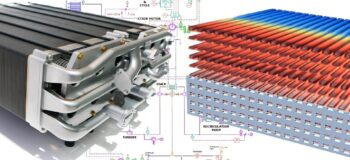
- the fuel cell stack,
- the air supply system and its control at the cathode side,
- the hydrogen recirculation loop and its control at the anode side,
- the stack cooling system.
This model allows to evaluate the energetic performance of a Fuel Cell Electric Vehicle with system simulation : the vehicle range, the vehicle energetic performance and the hydrogen consumption for a realistic driving cycle.
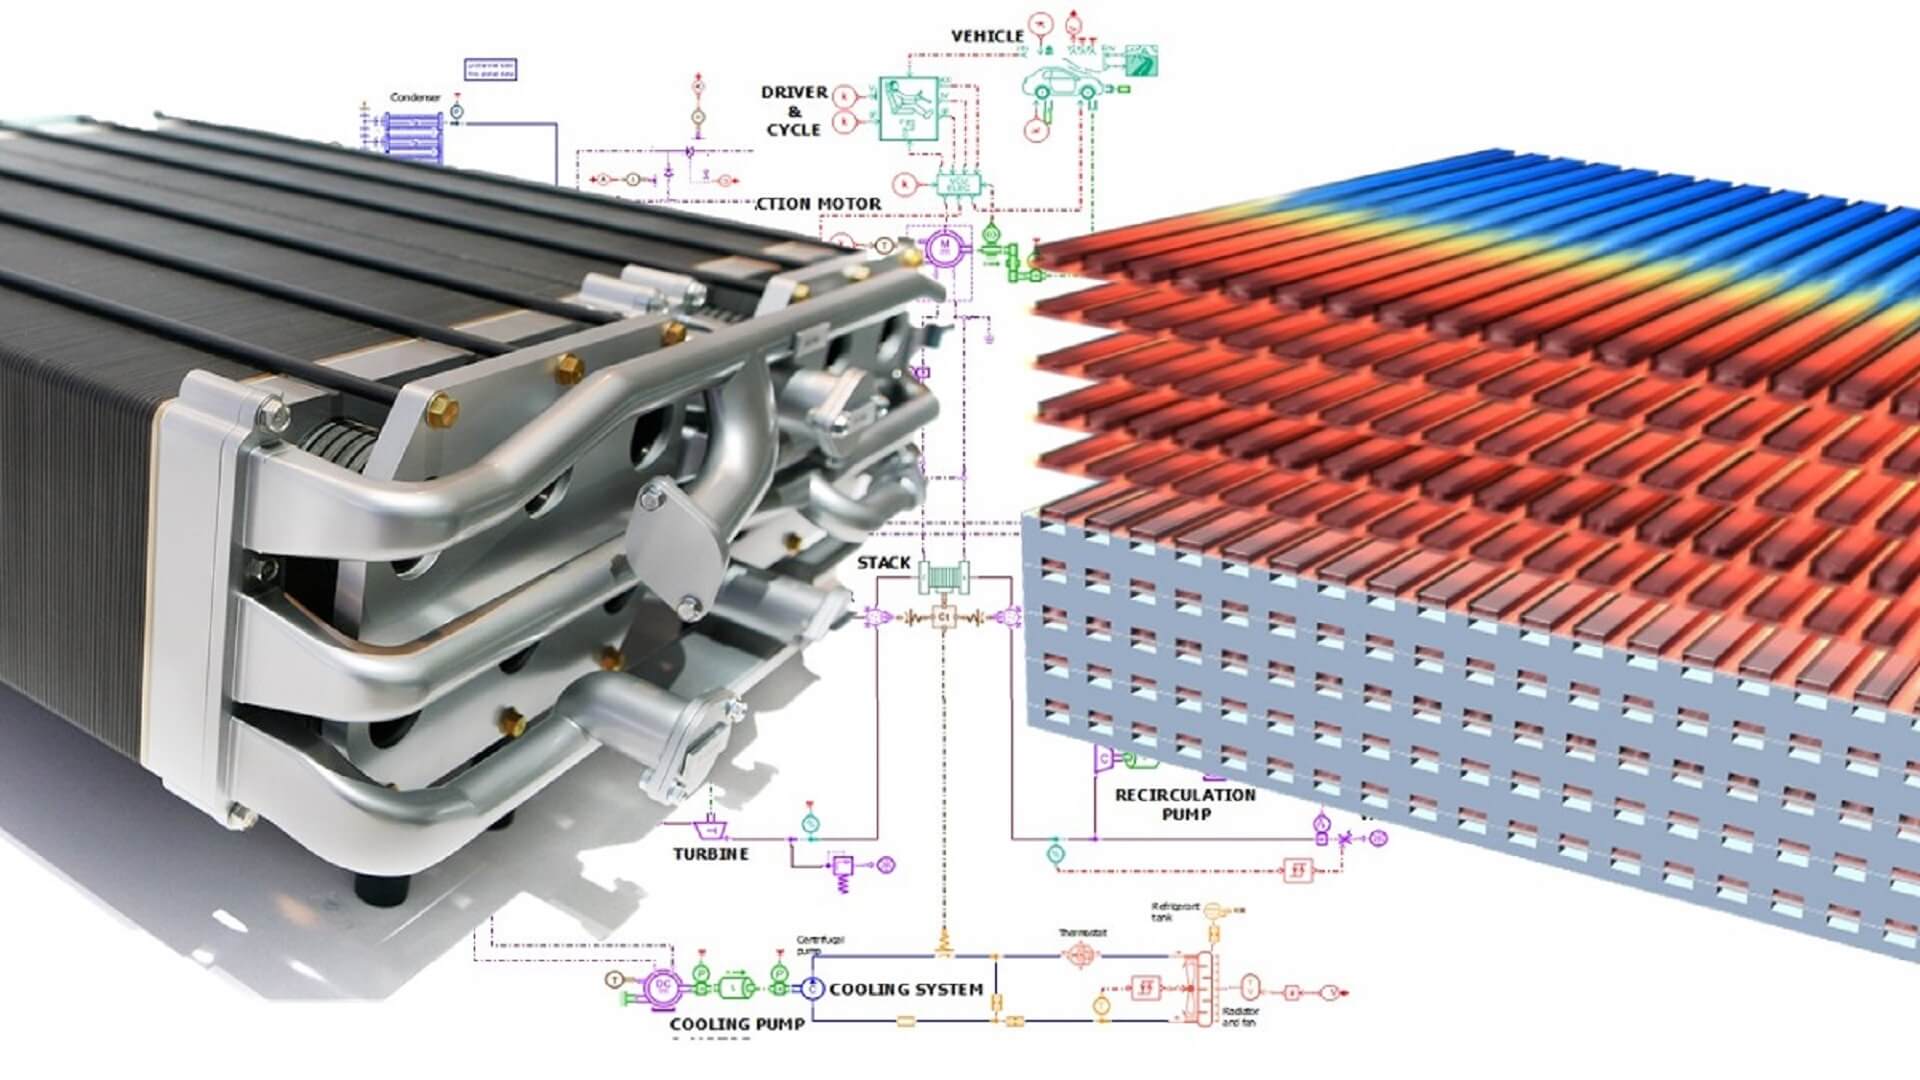
Description
On the left side of the sketch, components without any port are used to define:
- the gas species in the mixtures, the gas properties,
- the liquid water properties and the water phase change conditions,
- the thermal properties of the solid part of the stack,
- the cooling system model data (coolant properties and ambient conditions).
On the right side of the sketch stands the Fuel Cell Electric Vehicle model. It is composed of 6 different subsystems:
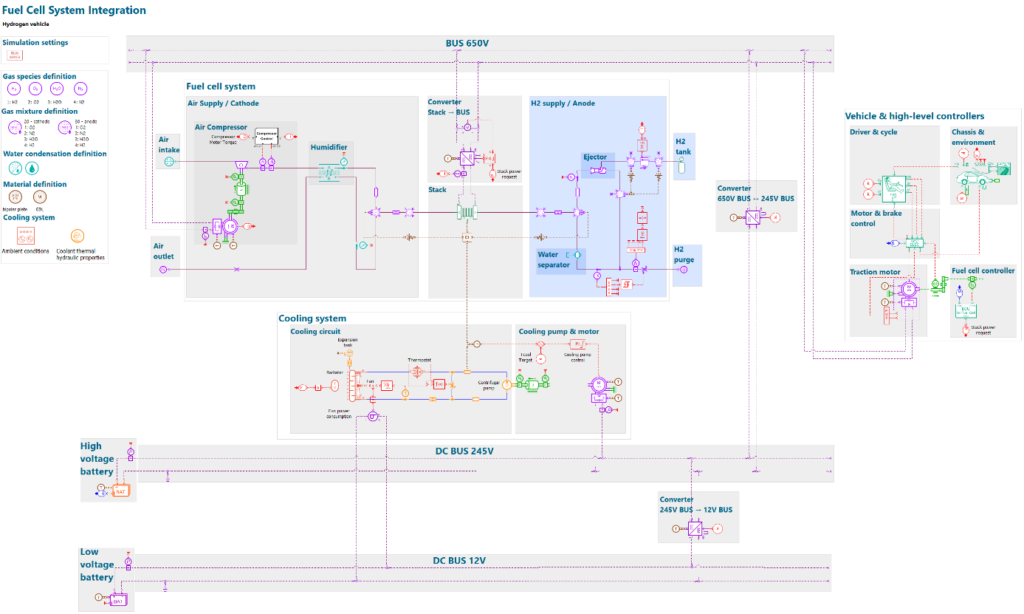
- the vehicle and high-level controllers:
- the driver and cycle: the driver component is used to predict the driver acceleration and the braking command in order to fulfill the scenario. The parameter window of the driver component makes it possible to define different driving cycles, with or without slope. In this demo, we have selected the WLTC cycle. It includes urban, suburban and highway driving with velocity dynamics representative of real conditions.
- the motor and brake controller: it computes the requested motor torque to ensure the acceleration. It also gives the needed braking command of the vehicle to follow the driving cycle.
- the chassis and environment: the vehicle component is used to evaluate the operating car acceleration and velocity throughout the scenario. This velocity mainly depends on the electric machine torque, the resistive forces applied on the vehicle and the vehicle mass.
- the traction motor: the motor model gives the requested torque computed in the Vehicle Control Unit (VCU) to the powertrain. A transmission ratio is applied between the electric motor and the wheels.
- the fuel cell controller: in function of the vehicle power demand and of the state-of-charge thresholds set in the fuel cell controller, it decides which of the fuel cell stack or the battery provides energy to the system.
- the electric circuit:
- a 245V high-voltage bus where the HV battery powers the coolant pump.
- a 650V power-boost bus where the fuel cell stack, the air compressor and the traction motor are plugged in. A DCDC converter links these 2 buses together.
- a 12V low-voltage bus where the LV battery powers the radiator fan.
Note that regenerative braking, through the traction motor, is considered in the model. The stack/battery control strategy can be modified in the fuel cell controller. One can also develop its own control model using the StateChart functionality or coupling with a control model developed in another simulation environment.
- the fuel cell stack: it evaluates the stack voltage considering the current, the temperature and the operating conditions at the cathode and the anode. The electrochemical submodel with 2 diffusion components is set so that the stack voltage can depend on the reactive species conditions at the electrodes. It also predicts the products and reactants’ molar flow rates due to the chemical reaction and models water transport across the membrane. The dynamic thermal behavior of the stack is predicted considering a single thermal capacity for both the membrane and the bipolar plates. It results from the balance between the heat generated by the fuel cell stack and the heat removed from the coolant loop. The traction motor power request drives the fuel cell stack operation through a DCDC converter connected to the high voltage electrical circuit.
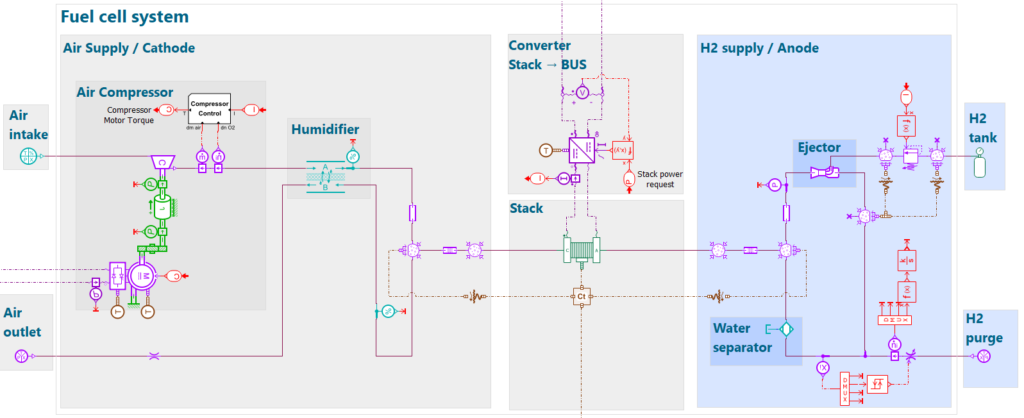
- the air supply system
- the compressor controller: it computes the torque needed by the electric motor powering the compressor to ensure the O2 stoichiometry target.
- the air compressor: it gives the needed air mass flow rate to the stack component in order to respect the stoichiometry target. The power is provided by an electric motor which delivers the necessary rotational speed to ensure the requested mass flow rate.
- the membrane humidifier: it is used to humidify the dry incoming air thanks to the wet air from the outlet of the stack.
- the cathode side of the stack: it is modeled by 2 gas mixture chambers separated by a diffusion component. They respectively model the gas mixture composition in the channels and at the cathode. The diffusion component models the diffusion across the Gas Diffusion Layer (GDL)
- the hydrogen recirculation loop
- the tank: the hydrogen is provided to the anode loop thanks to a high-pressure tank. An intermediate pressure regulator reduces the pressure. An ejector finally provides the necessary H2 molar flow rate.
- the anode side of the stack: it is modeled by a 2 gas mixture chambers separated by a diffusion component. They respectively model the gas mixture composition in the channels and at the anode. The diffusion component models the diffusion across the Gas Diffusion Layer (GDL)
- a water separator: a functional model is used to remove liquid water from the mixture at the anode side.
- a purging valve: when the molar fraction of nitrogen is higher than a target value, this valve opens. It wastes some hydrogen reactants but avoids H2 dilution which decreases stack performances.
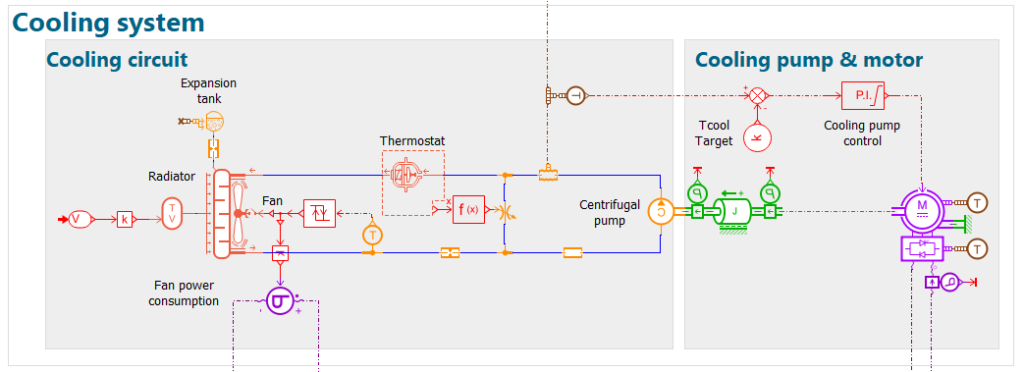
- the cooling system: the cooling system is used to regulate the stack temperature. A pump is used to generate the coolant (water and glycol mixture) flow in the cooling loop. When the coolant temperature rises above a specified threshold, the thermostat starts to open and releases coolant into the radiator branch. A second threshold triggers the fan when additional cooling power is needed.
Vehicle and powertrain performances
The complete model allows you to evaluate the energetic performance of a Fuel Cell Electric Vehicle with system simulation.
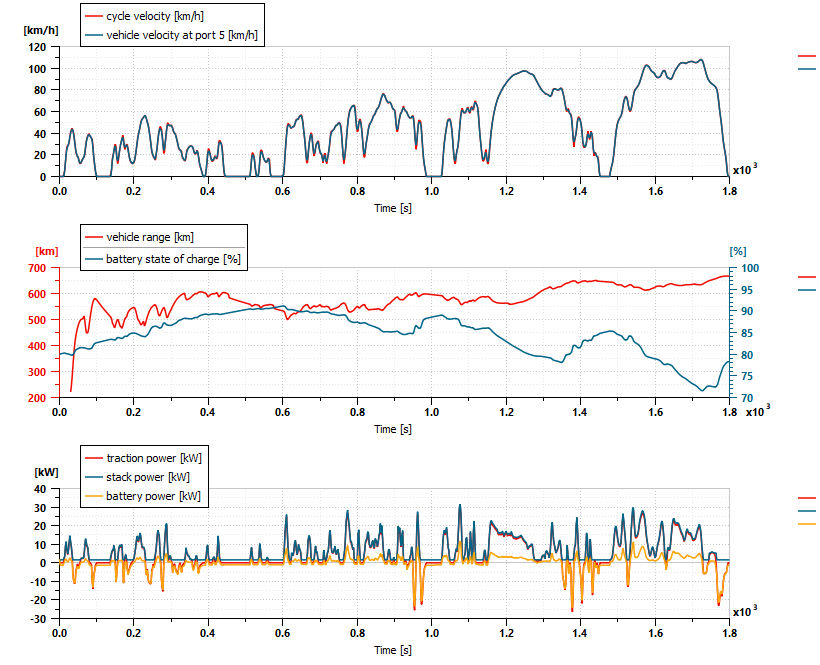
The 1st graph shows the driving cycle speed request and the vehicle speed calculated with the vehicle model. The 2 curves almost fit perfectly with one another which means the vehicle follows the driving cycle.
The 2nd graph shows the vehicle range and the battery state-of-charge (SOC). The battery SOC is not exactly the same as the one at the initial stage. The vehicle range may therefore be slightly different if taking into account the energy variation of the battery during the cycle.
The 3rd graph shows the control strategy between the fuel cell stack and the battery to provide the requested power to the whole circuit. The stack provides the necessary power to the traction motor and the battery to the auxiliaries. The battery is charged by the stack when no power is requested for the traction and recovers power during regenerative braking.
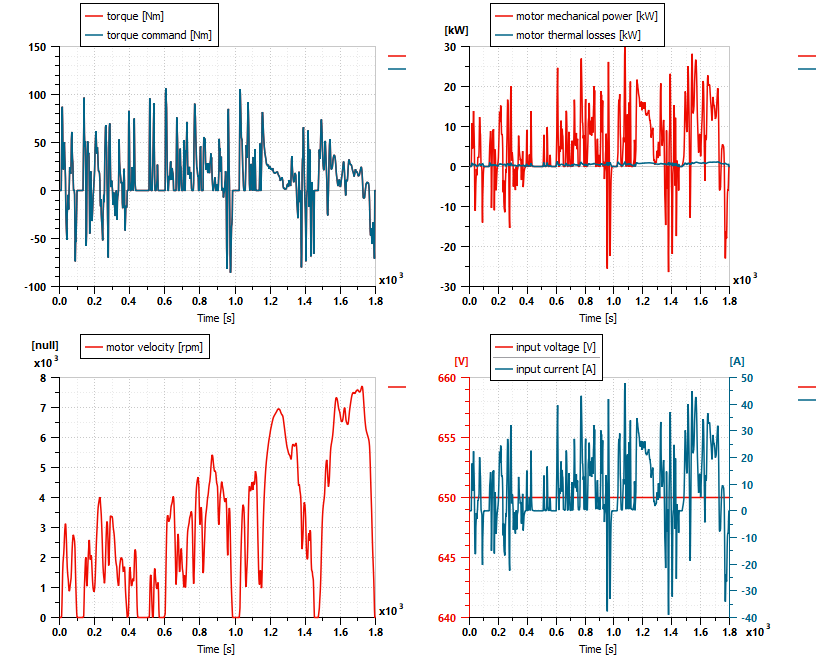
The top left corner graph shows the traction motor torque in comparison with the torque request from the motor controller.
The top right corner graph shows the motor mechanical power used to move the car along the driving cycle and the corresponding motor losses.
The bottom left corner graph shows the traction motor velocity.
The bottom right corner graph shows the voltage and the current in the traction motor.
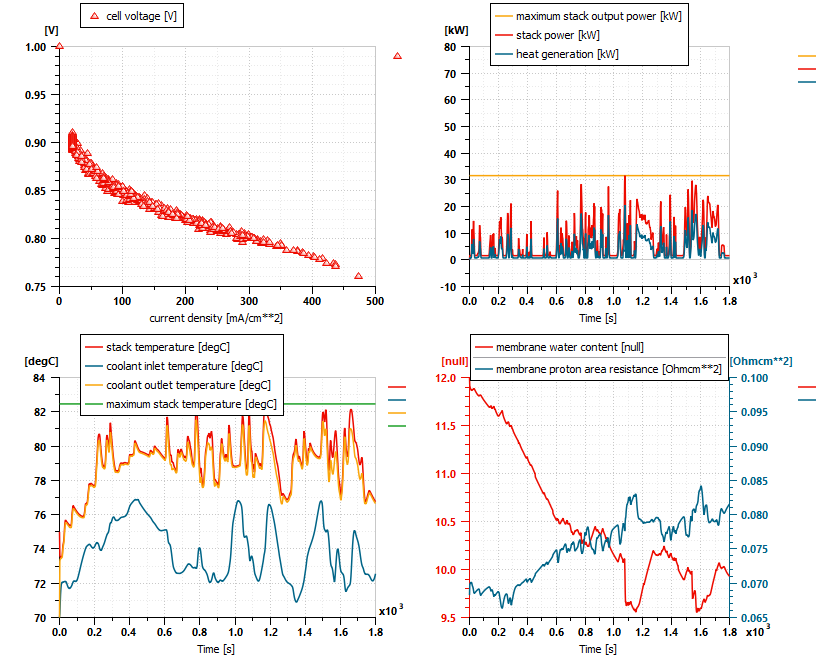
Stack performances
The top left corner graph shows the stack voltage operating points in the function of the current density. This is an overview of the fuel cell stack polarization curve at low/middle current densities and under different operating conditions.
The top right corner graph shows the stack power and the thermal losses due to the reaction. The maximum stack power delivered during the driving cycle is also plotted.
The bottom left corner graph shows the stack and the coolant temperature in the cooling loop. The coolant temperature is lower than the stack temperature. This is due to the non-ideal heat exchange set up in the sketch between the stack and the cooling system.
The bottom right corner graph shows the membrane water content and the membrane proton-specific resistance. The lower the membrane water content is, the higher the membrane resistance is and so the greater the ohmic voltage drop is.
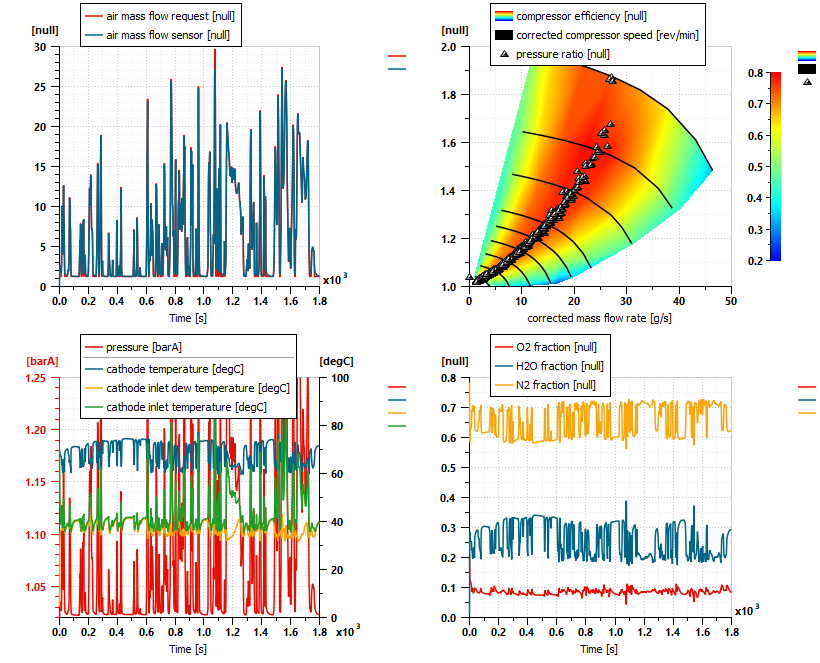
Focus on the cathode side
The top left corner graph shows the air mass flow rate entering into the stack in comparison with the requested air mass flow rate from the air mass flow rate controller.
The top right corner graph shows the compressor pressure ratio according to the corrected mass flow rate. The curve is superimposed on the compressor efficiency colored map and on the compressor corrected velocity isolines. The more the circuit characteristic and the compressor efficiency follows the line, the higher the compressor efficiency. Therefore, the lower the outlet temperature increase is.
The bottom left corner graph shows the pressure, the temperature, the inlet temperature and the inlet dew temperature at the cathode. The dew temperature being the temperature where water starts to be in the liquid phase, it is consistent to see a stack temperature higher than the dew temperature.
The bottom right corner graph shows the species molar fraction at the cathode. The O2 molar fraction is lower than the stack inlet O2 molar fraction because of the chemical reaction.
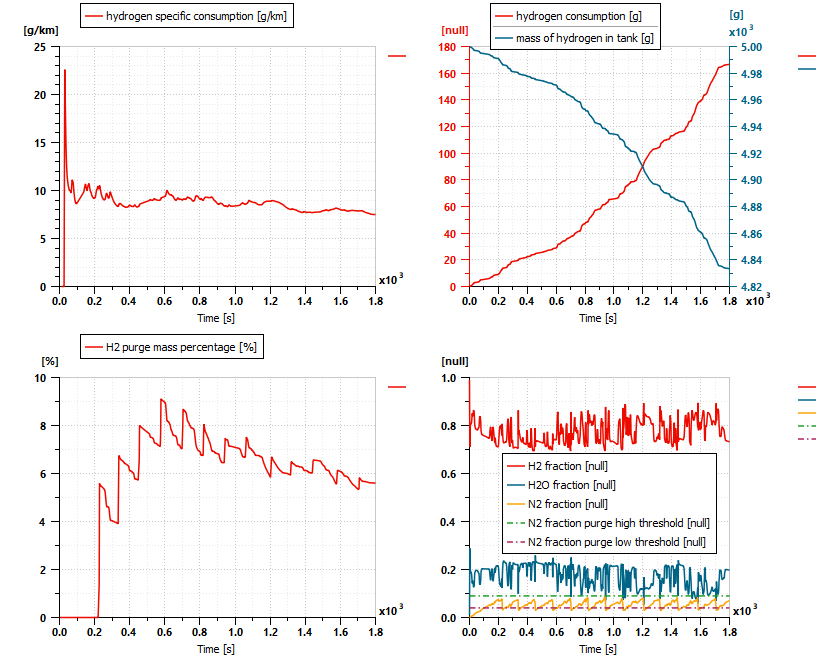
Focus on the anode side
The top left corner graph shows the H2 consumption per km along the driving cycle.
The top right corner graph shows the H2 consumption in g and the mass of H2 in the tank during the driving cycle. As expected, the H2 consumption is equal to the H2 which has left the tank.
The bottom left corner graph shows the percentage of H2 lost by the purges considering the drive cycle.
The bottom right corner graph shows species molar fraction at the anode. The N2 molar fraction oscillates between a high threshold and a low threshold value respectively corresponding to the purge start and the purge stop conditions.
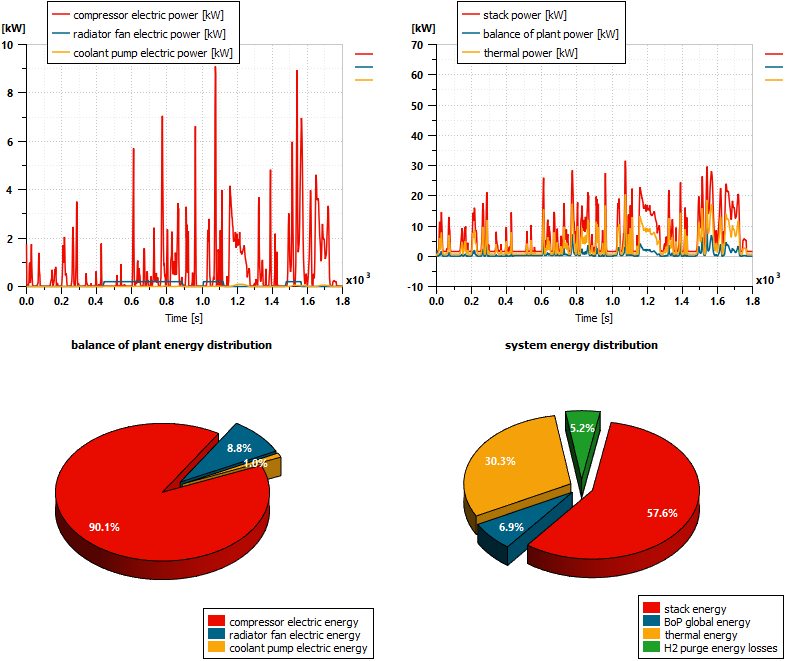
Electric consumers
The top left corner graph shows the power consumed by the auxiliaries all along the driving cycle.
The top right corner graph shows the power distribution in the whole system all along the driving cycle.
The bottom left corner graph shows the distribution of the energy consumed by the auxiliaries. The compressor appears to be the main consumer.
The bottom right corner graph shows the energy distribution in the whole system. 58% of the energy is converted by the stack into electric power. The other part is converted into heat or used by auxiliaries.
Conclusion
We have illustrated here how to evaluate the energetic performance of a Fuel Cell Electric Vehicle with system simulation and simulate the physical behavior of a fuel cell system integrated in a FCEV. The virtual evaluation of design choices makes possible to evaluate the performances of the system and its relative controls. It also helps to point out weaknesses and needed improvements. The interest of such a model is the capability to predict interactions between the vehicle powertrain, the fuel cell and its auxiliaries as well as the controls.
By Antoine Lepoil and Benoit Honel
Going further
- On-demand webinar “Evaluating fuel cell systems performance using a simulation-based approach”, with our Siemens experts and Jules Sery from IFP Energies Nouvelles
- Customer story “OMB Saleri uses Simcenter to predict H2 valve behavior and rapidly develop innovative products”
- Blog post “Green hydrogen production simulation within Simcenter Amesim”
- Blog post “Ensure the safety of hydrogen mobility“
- Technical paper “On-Board Liquid Hydrogen Cold Energy Utilization System for a Heavy-Duty Fuel Cell Hybrid Truck”
What to read next:


Comments
Comments are closed.
Fuel cell systems are quite complex. System simulation definitively helps to better understand interactions between components and physics in order to reach the best system integration with the highest system efficiency, reliability and safety.