Drag Reducing Agents: finding the best balance between extra costs and more profits
Introduction
Since energy efficiency and cost savings are at the top of everyone’s agenda, it’s no surprise that technologies that support this challenge are hot now. Further to this there is pressure in many industries to shift towards environmental-friendly practices.
This is one of the main reasons why the adoption of drag reducing agents (DRA) has grown in recent years in various industries such as oil and gas, pharmaceutical and agriculture. Overall, the DRA market is expected to grow into a $2.2 billion industry by 2028 (1). The oil and gas industry makes up 50% of this, where even small percentages of improvement have a huge financial impact, the use of DRA is a popular way to increase flow efficiency leading to reduced energy costs, improved safety, and a more efficient operation.

Principle
A DRA is like a lubricant for a pipeline. Just as a lubricant reduces friction and wear on mechanical parts, a DRA reduces the friction of a fluid as it flows through a pipeline by coating the wall. In doing so it smooths the roughness of the pipe wall and hence lowers the friction. This effect does degrade the further you travel from the injection point until the DRA is completely degraded and becomes part of the fluid.
Overall, the use of DRA is expected to continue to grow in the future as more industries look for ways to increase energy efficiency and reduce costs. As a result, the technology of DRA is advancing, new DRA formulations are being developed and DRA is used in a wider variety of applications.
Challenges
While this all sounds excellent in theory, in practice not all pipelines or applications are suitable for DRA. It may not be effective for certain types of fluids or in certain types of pipelines and DRA is not for free either. Additionally, the use of DRA can also lead to some downsides such as increased maintenance costs, added complexity and higher operating costs. This makes it important to carefully investigate where, how much and how often DRA should be used in the pipelines, to make sure the result is delivering a positive return on the investments.
Simcenter Flomaster now supports the modeling of DRA in pipelines, making it easier to make the right decisions and get the most optimum results. With Simcenter Flomaster the system dynamics of large piping networks for fluids and gasses can be simulated based on accurate physics models. These models can be used to quickly compare the effect of modification in these networks since they can simulate the pressures, flow rates, and forces caused by the flowing gasses and fluids in the network.
Examples
We look here at 2 main questions to be answered when considering the use of DRA in a network
Question 1: How much Drag Reducing Agent should I inject?
Everything has its limits, also the effectiveness of DRA. By injecting more DRA the throughput increases, but there is a critical point where adding more DRA has no effect anymore, other than costing you more. The challenge is to find this sweet-spot and get the most out of the DRA usage.
When we look at the increased flow rate that can be achieved with varying levels of DRA we can observe an increase from 510 kg/s (15620 barrels Oil per hour (bar/hr)) to 515 kg/s (15773 barrels Oil per hour (bar/hr)). It shows that it can be a thin line between profits and losses for the use of DRA, because with only a difference of 153 barrels Oil per hour, margins are small in this example. Still, in large scale transportation networks this can be the difference of thousands of dollars per hour or in another context, the same throughput but with reduced pumping energy.
When we dive into this a bit deeper, we can see how varying rates of DRA affect the overall flow.
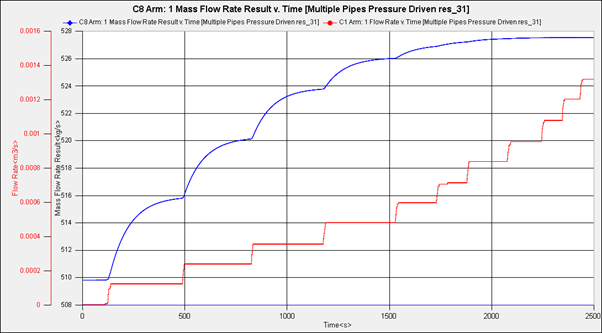
As we can see here initially no DRA is injected and the pipeline has a flow rate of approximately 510 kg/s (15620 barrels Oil per hour (bar/hr)). When we introduce the first injection of DRA this is improved over time as the DRA coats the pipeline to eventually achieve 516 kg/s (15803 barrels Oil per hour (bar/hr)). As we continue to introduce more and more DRA into the system in small, regular, increments we can see that with each increase the effect gained is slightly less until eventually with a DRA flow rate of 0.0008 kg/s (0.00503 barrels Oil per hour (bar/hr)) there is no additional gain achieved by injecting more DRA.
This result clearly shows the tradeoff between injecting more DRA and achieving a higher throughput while also showing that there is a limit to this. The trick is to knowing at what point there is an optimal throughput gain against the DRA cost. It is here that simulation can be used to significant benefit to perform a cost/ energy/ throughput optimization to maximize profitability/ efficiency of a pipeline.
Question 2: What’s the optimal amount of injection points in my network?
The other main question to answer is what the most optimal amount of injection points is along the pipeline. Since the concentration of DRA in the pipeline reduces along the length of the pipeline, adding more injection points brings better performance, but also comes at a higher CAPEX (capital expenditures) for installation and OPEX (Operating Expenses) for DRA consumption, power consumption and transportation fees. Finding the right balance is not easy to achieve, and almost impossible without a dedicated network flow simulation in Simcenter Flomaster.
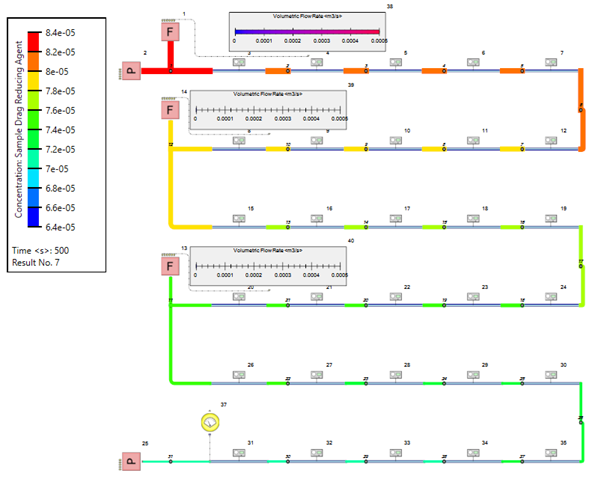
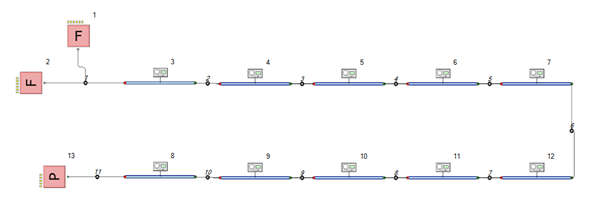
In this case the model clearly shows that with only a single injection site the concentration of DRA reduces along the length of the pipeline resulting in reduced overall effectiveness. If the pipeline were extended further, the complete degradation of the DRA would be observed.
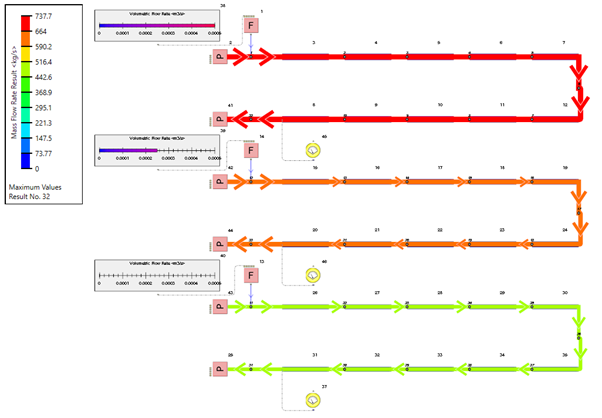
When we start to look at real world examples such as this model from El Paso to Houston, we clearly see the benefit that adding DRA (top model) provides to the model without DRA (bottom).
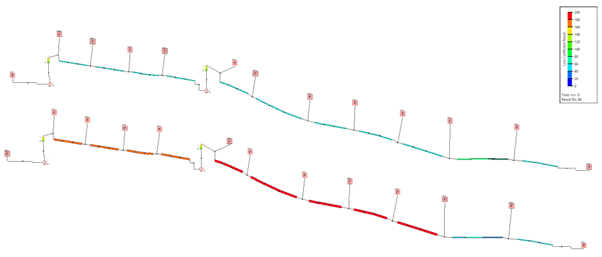
The upper model has a flow rate of 1074 kg/s (33 019 barrels Oil per hour (bar/hr)), while the second model has a flow rate of 1024 kg/s (31 362 barrels Oil per hour (bar/hr)). This is a difference in transportation throughput of 1657 barrels per hour. Assuming we are transporting crude oil, this is a difference of $139,470 per hour for additional transported product between using DRA or not.
Next steps
Finding the right balance is of utmost importance when trying to improve the efficiency of flow distributions of large piping networks. It is easy to make the wrong decision resulting in a negative impact, but the upside is a significantly lower operational cost when done right. The thermohydraulic simulation capabilities of Simcenter Flomaster support this challenge allowing its users to virtually predict the physics quickly and easily, way before any costly investments in the infrastructure are made. As the next step, part of this journey can even be automated to drastically increase the number of variants in the evaluation, resulting in a complete exploration of the design space.
Watch also this video to learn how to model a drag reducing agent with Simcenter Flomaster:
References
1. Reports and Data. Drag Reduction Agent Market Size, Share and Analysis By Product Type (High Viscosity Glue, Low Viscosity Glue, Rubber Latex), By Application (Crude Oil, Irrigation, Blood Treatment, Chemical Transportation, Others), By Region, Forecasts To 2027. New York : Reports and Data, 2020. p. 143.