Physics, Physics and Visual Physics
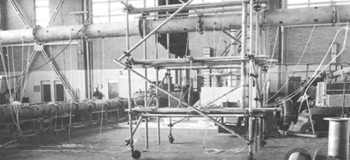
When it comes to simulation software, being able to accurately model the physical phenomena of interest is key. Simcenter Flomaster has its physical foundations on the experiments carried out by Don Miller and his team at the British Hydrodynamic Research Association in the late 1960’s.
Physics
Built on these strong foundations, Simcenter Flomaster continues to deliver new and accurate physical capabilities to address the challenges of the industry. For example, in my last blog I talked about the possibility of modelling accelerations and attitudes of systems that are not on solid ground as the fuel system of an aircraft or the fluid systems of a submarine.
While delivering new physical capabilities we face the problem of how to allow users to quickly, easily and thoroughly interpret the results and understand what is really going on in their systems. We are all used to the amazing post-processing capabilities of 3D CFD tools like Simcenter STAR-CCM+ or Simcenter FLOEFD, but a system simulation tool is a completely different beast. The traditional way of reviewing results for system simulation is using tables or 2D graphs but this is far from being quick and easy.
Visual Physics
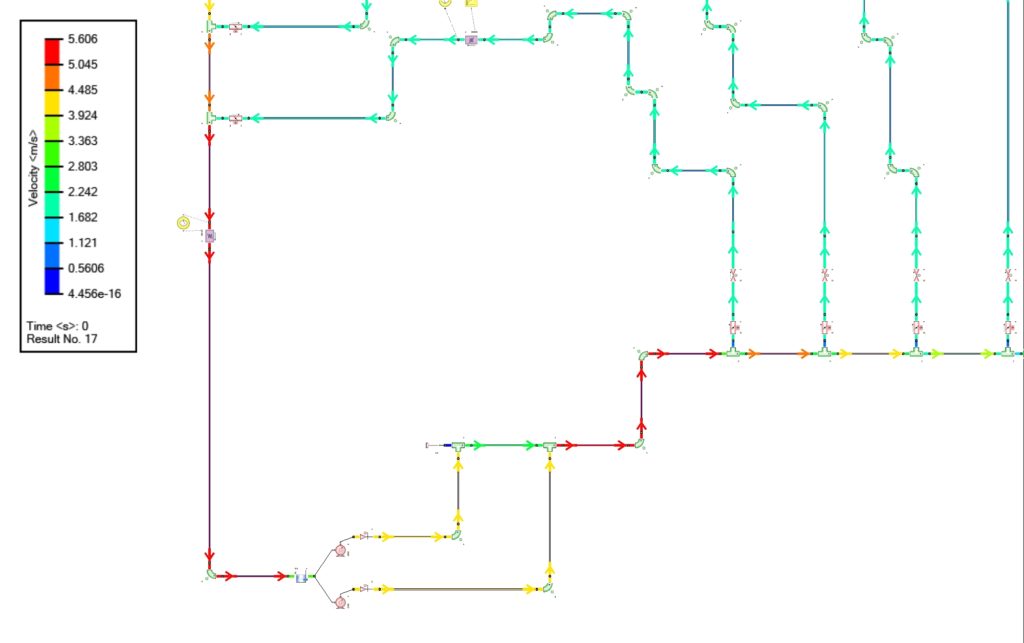
Allowing our customer to quickly and easily interpret simulation results and ultimately to understand what is going on in their system is a priority for us. This is why besides the development of new physical features in Simcenter Flomaster, we have started to develop what we call Visual Physics. This is a set of tools that allows users to literally visualize the physical processes happening in their systems. Velocities and flow rates can be displayed as colored vectors and animated during the simulation or as a playback. Also, the system schematic can be colored to visualize pressures, temperatures or any other results.
Play to see it in action!
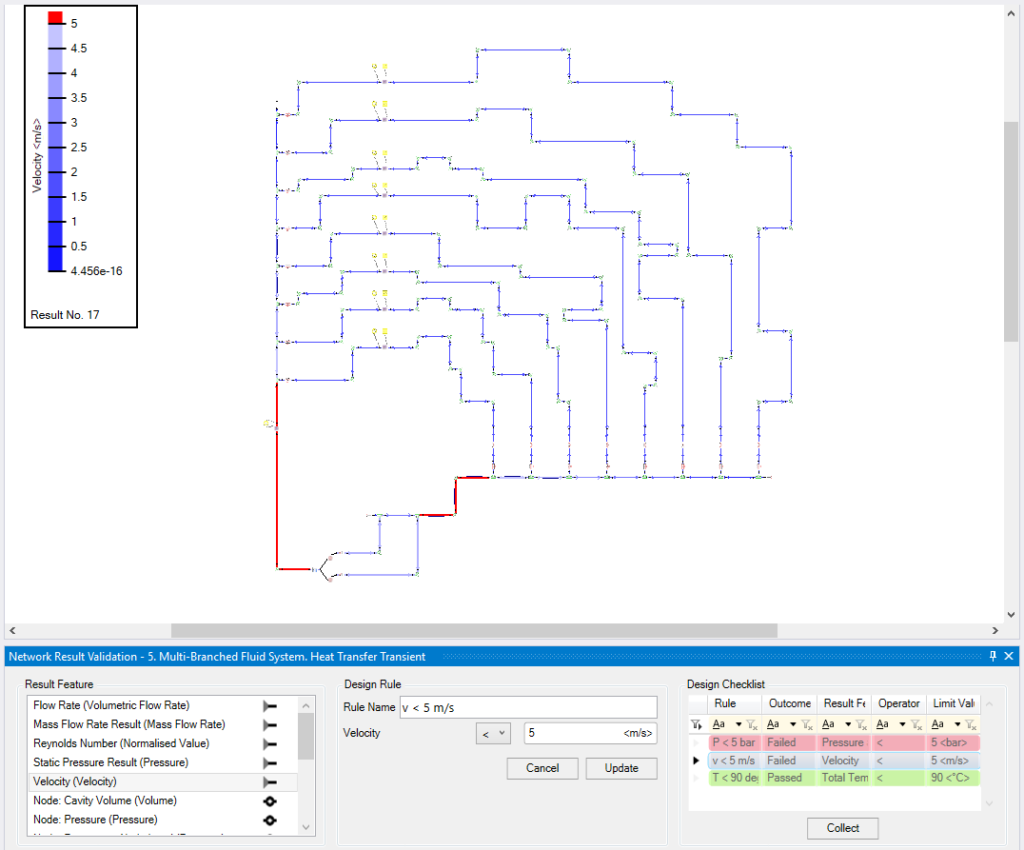
In addition to this we also allow users to define goals and constraints (e.g. velocity should be less than 5 m/s) and immediately check if these are fulfilled. This check is done visually: unfulfilled goals are displayed in red depicting the area of the system where the problem occurs.
So, in conclusion, with Simcenter Flomaster you can safely experiment new innovative solutions and designs, because Visual Physics allows you to understand the behavior and the performances of your systems and to spot out problematic areas at a glance.


