Balancing vehicle noise and vibration with e-efficiency for e-powertrains – a “multitasking challenge”
How to assess multiple targets with one measurement?
In the modern world, everything is about efficiency — at work, at home, everywhere. We all try to do more with less time, and multitasking seems like the obvious answer. And yet, research tells us we aren’t actually that great at it. Well, I won’t pretend I have a magic formula — with my family, I’ve learned that going with the flow works surprisingly well. But let me introduce you to a real multitasker that can actually save you time.
Efficiency and the electric vehicle
Efficiency is a buzzword in the electric vehicle (EV) world — and for good reason. It is directly linked to vehicle range, one of the top purchase criteria for EV buyers. Ask anyone considering an electric car and the first question is almost always: “What’s the range?”
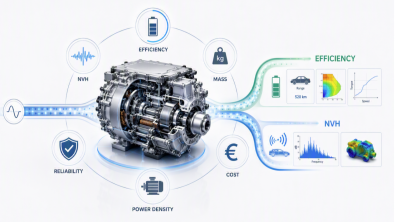
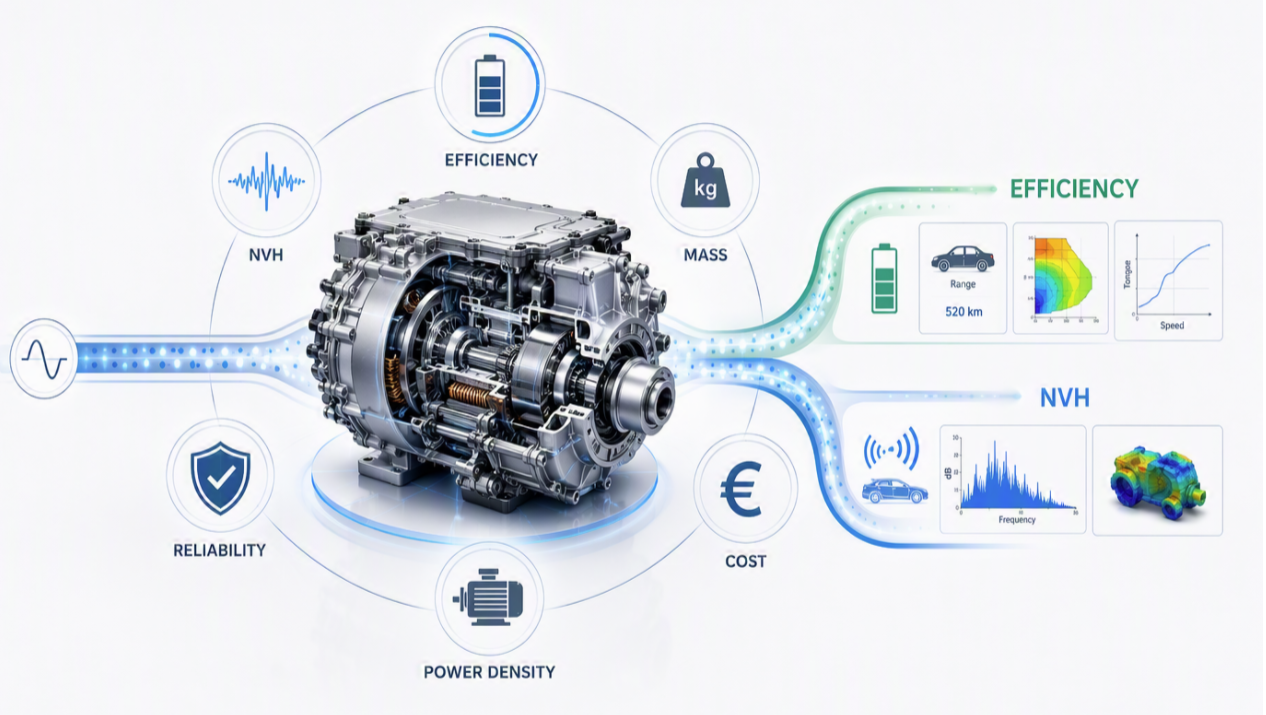
So where does the e-powertrain fit in? It is one of the most critical contributors to vehicle efficiency — but efficiency is just one of several competing design targets that engineers must balance simultaneously. Mass matters because heavier components reduce efficiency and drive up cost. The price of the e-powertrain itself is critical for market competitiveness. Reliability is non-negotiable — components like drive shafts and axles must withstand long-term torsion and impact loads. Power density is increasingly important, particularly for rear axle configurations where design space is tightly constrained. And then there is noise and vibration.
That last one deserves special attention. While efficiency is the primary design driver, NVH is the most common source of budget overruns in e-powertrain development. The main culprits are the gearing, the e-motor, and the inverter — with gearing being responsible in most cases. E-powertrain engineers are, by definition, multitasking.
The NVH challenge
Airborne NVH performance is typically assessed through volume velocities or radiated sound power. Structure-borne NVH performance is typically evaluated either via accelerometers or more rigorously as blocked forces for having the best structure-borne design indicator, to predict interior noise and vibration prediction and to open the door to for virtual prototyping.
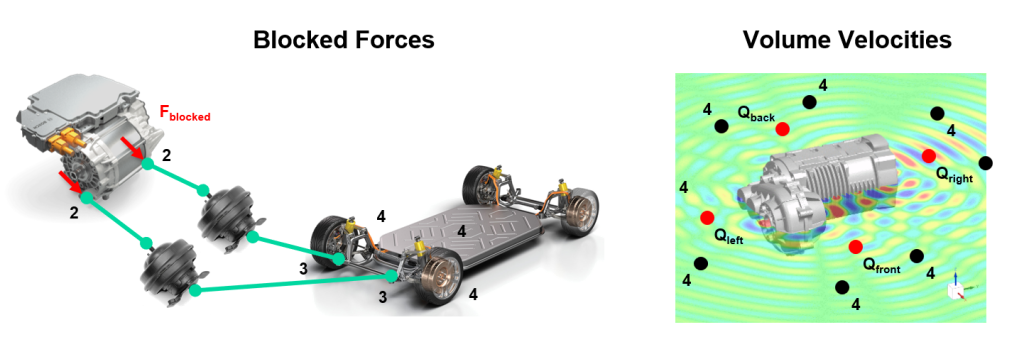
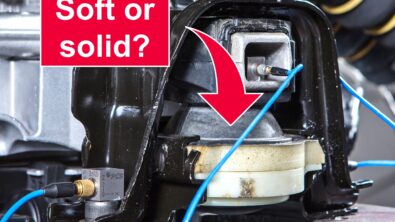
Here is the core tension: measures that reduce NVH often hurt efficiency, and vice versa. Take mount stiffness as an example. E-powertrains typically use two levels of mounts — powertrain to subframe, and subframe to body. Softer mounts improve structure-borne noise insulation, but reduce torque transmission efficiency. Similarly, changing inverter control strategies to improve efficiency can create NVH and tonal noise.
The example case — The demonstrator test bench
Test bench setup
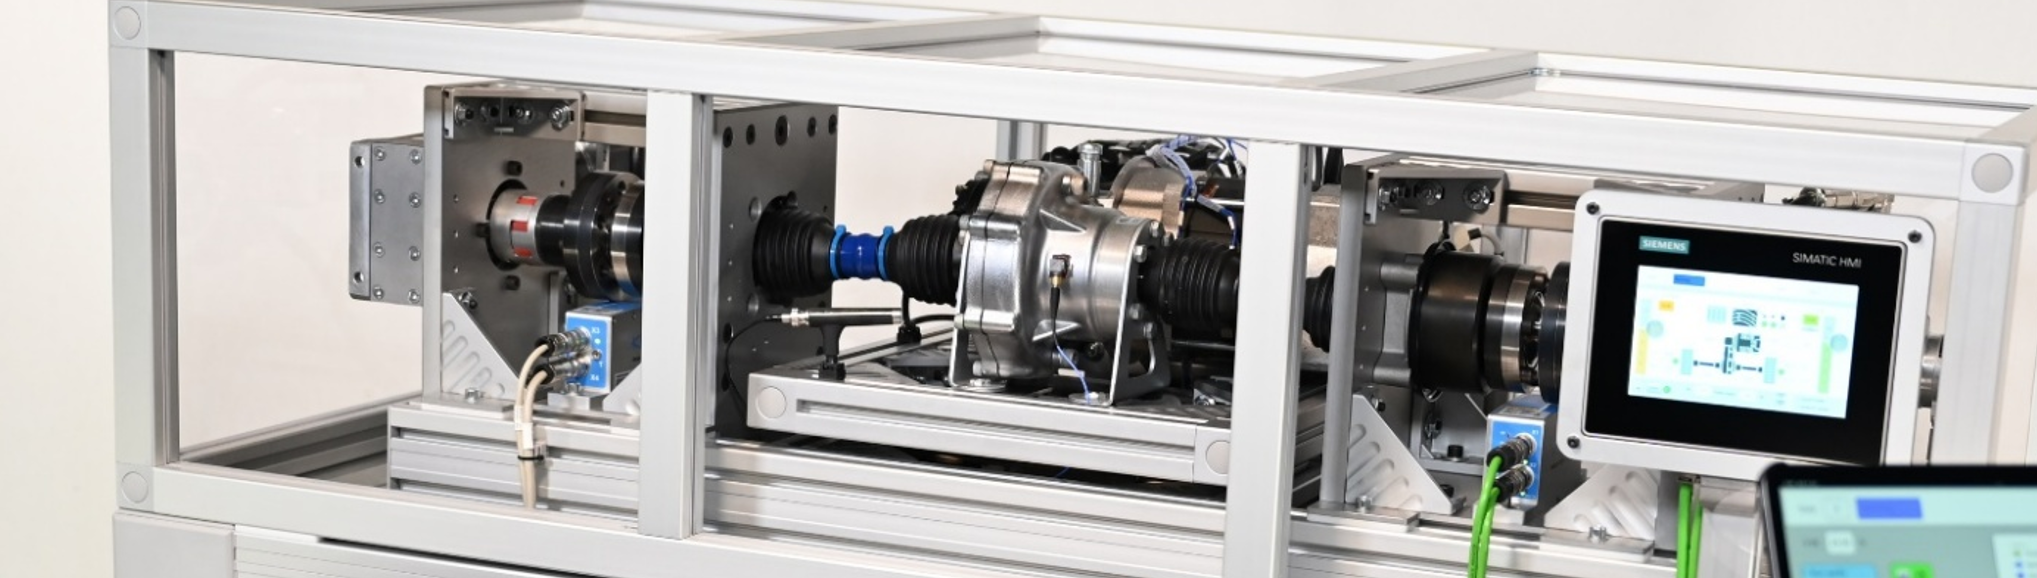
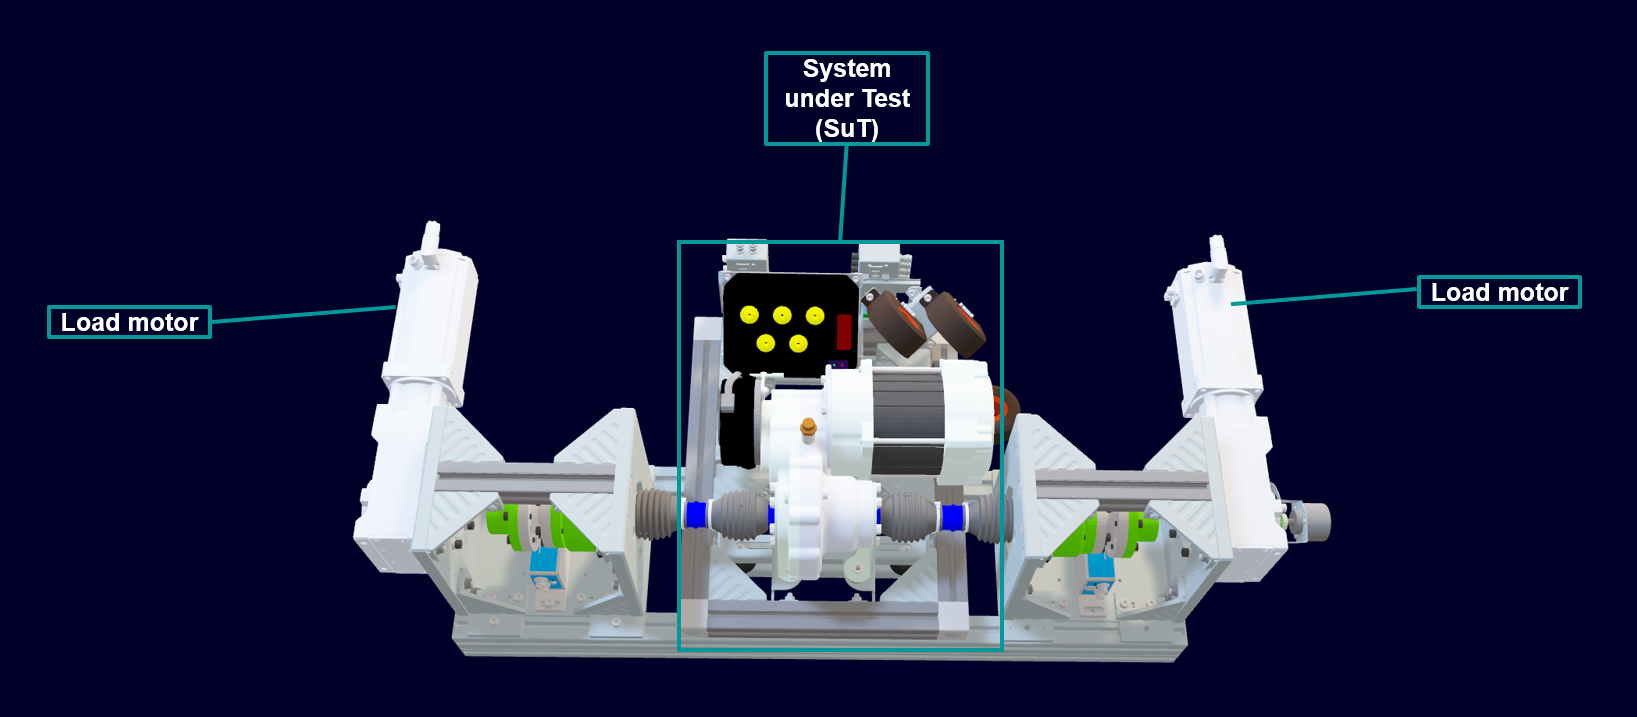
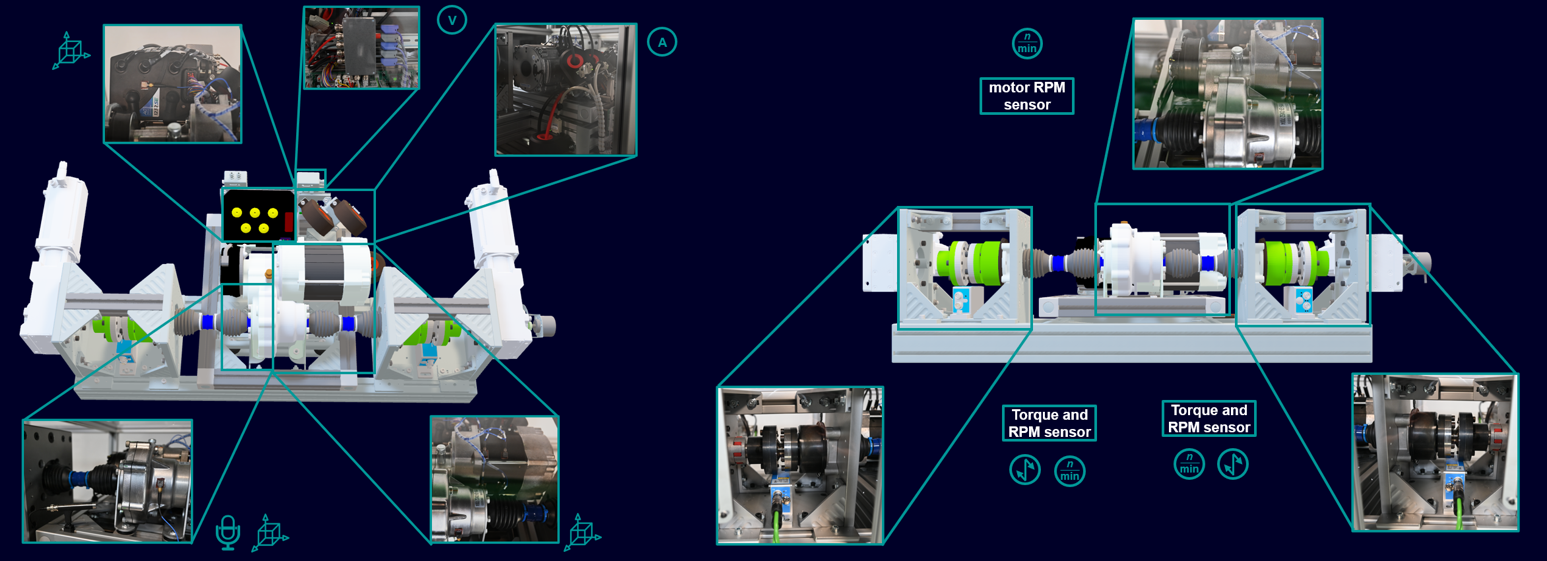
To demonstrate this measurement approach, let’s walk through our e-powertrain demonstrator test bench. The setup consists of the System under Test (SuT) — comprising an internal battery, inverter, e-motor, and gearbox — connected through axles to two load motors that simulate real driving conditions.
Instrumentation
The test bench carries two distinct sets of instrumentation serving the two measurement objectives. On the NVH side, two accelerometers are placed on the inverter and gearbox, eight further accelerometers are distributed across the e-powertrain body, and one microphone is positioned close to the gearbox. An RPM sensor is mounted on the e-motor. On the efficiency side, RPM and torque are measured at each axle, while current and voltage are captured both between the battery and inverter using one DC current sensor, and between the inverter and e-motor using two AC current sensors. The throttle signal serves as the measurement trigger.
Measuring e-efficiency
In motor mode, power flows from the battery through the inverter, into the e-motor, and out through the axles to the tires. The battery supplies direct current to the inverter, which transforms it into three-phase alternating current fed to the e-motor. The e-motor then converts this electrical power into mechanical power, measured on both sides of the rotating shafts as RPM and torque.
Each stage of this chain introduces losses. By comparing the power at each stage, two key efficiency metrics are derived — the inverter efficiency covering the electrical stage, and the e-powertrain efficiency covering the electromechanical conversion.
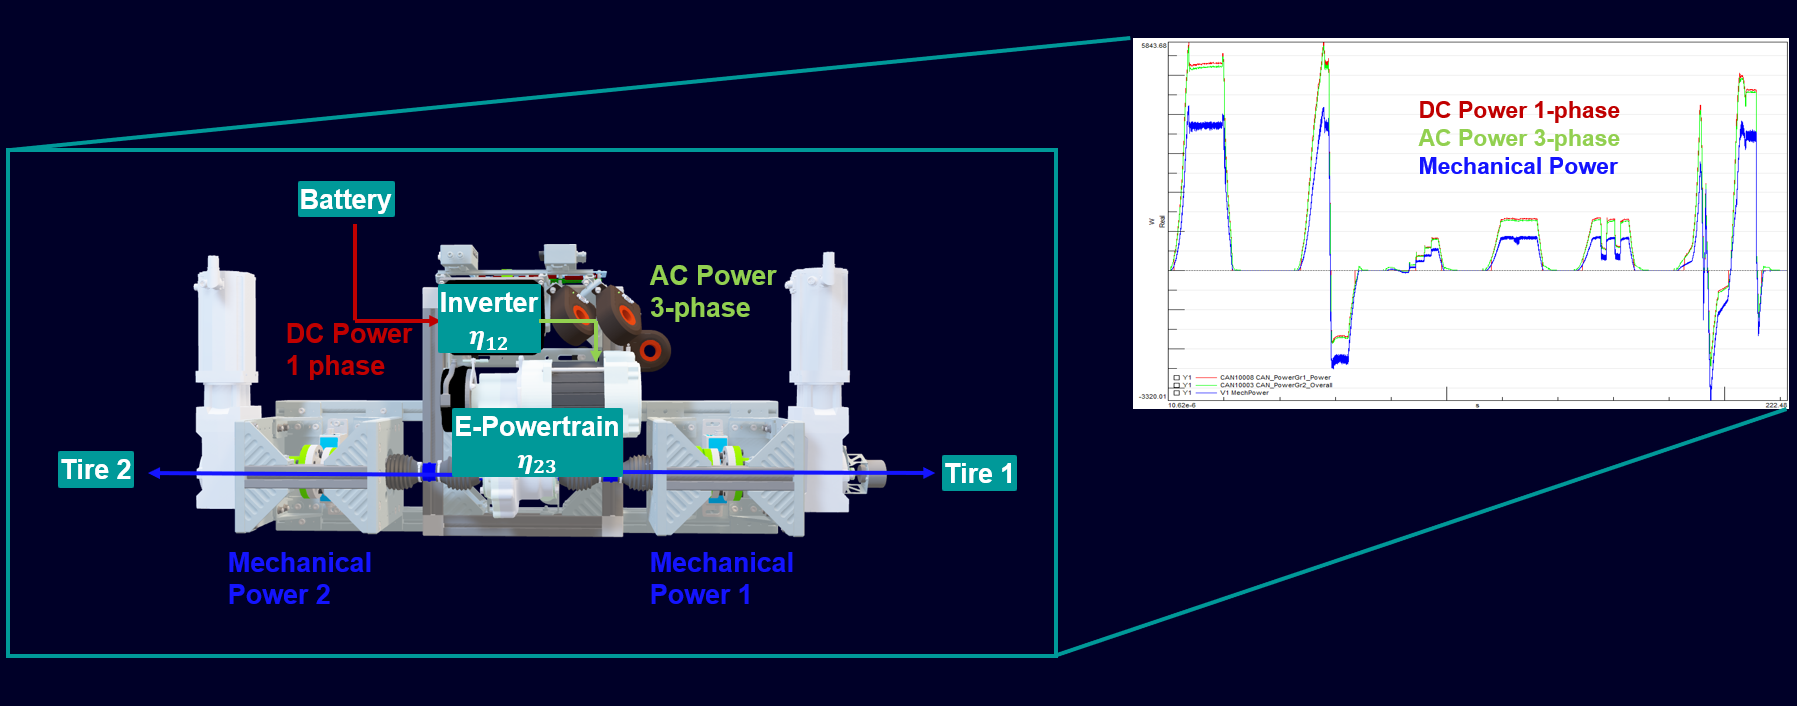
The graphic shows the power of the different stages of the -powertrain. Each stage loses a certain amount of power. Comparing those powers one gets the efficiency of the inverter and the e-powertrain, inverter efficiency and e-powertrain efficiency.
Coupling both systems — Synchronized data acquisition
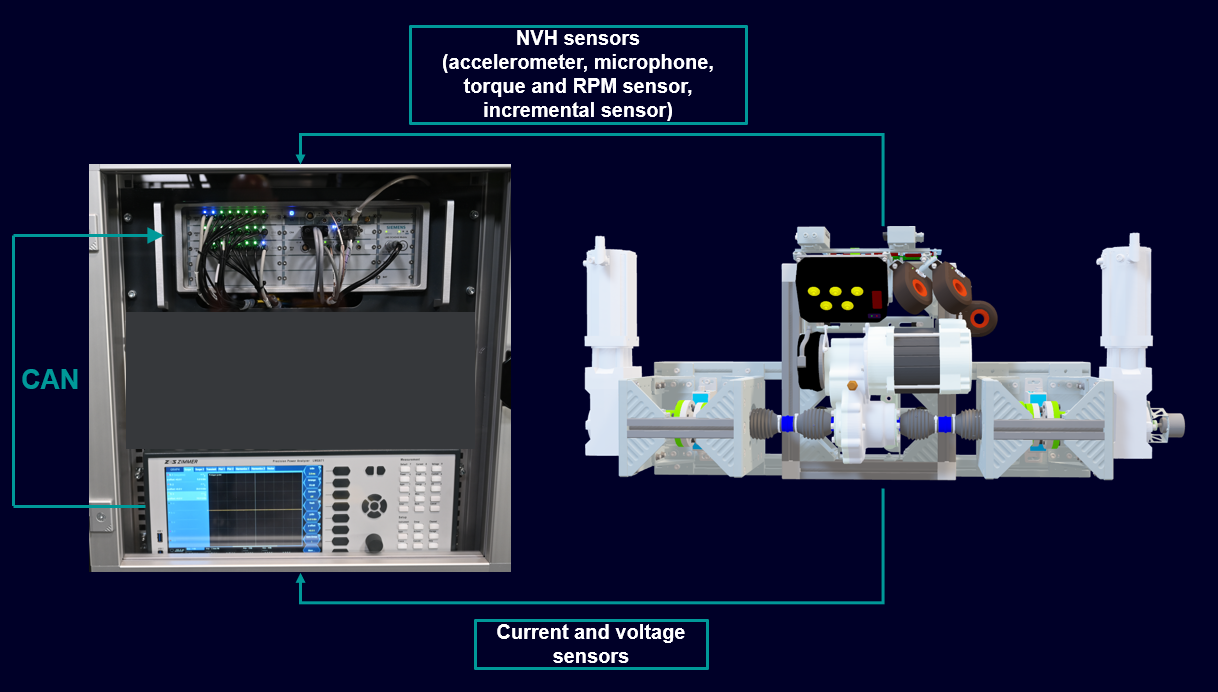
The ZES Zimmer power analyzer computes power and efficiency metrics in real time and streams them via CAN bus to the Simcenter SCADAS frontend. Electrical and mechanical efficiency metrics are streamed live, fully synchronized with the NVH data on a single shared time base. The output is defined in ZES Zimmer units, with the .dbc file loaded directly in Simcenter Testlab. In short, high frequency MHz sampling is translated into low frequency power and efficiency metrics streamed through CAN to the Simcenter SCADAS data acquisition system.
This synchronization is the key enabler — NVH and efficiency data share the exact same time stamps, making direct correlation between the two domains straightforward and reliable.
Data processing — Three parallel pipelines
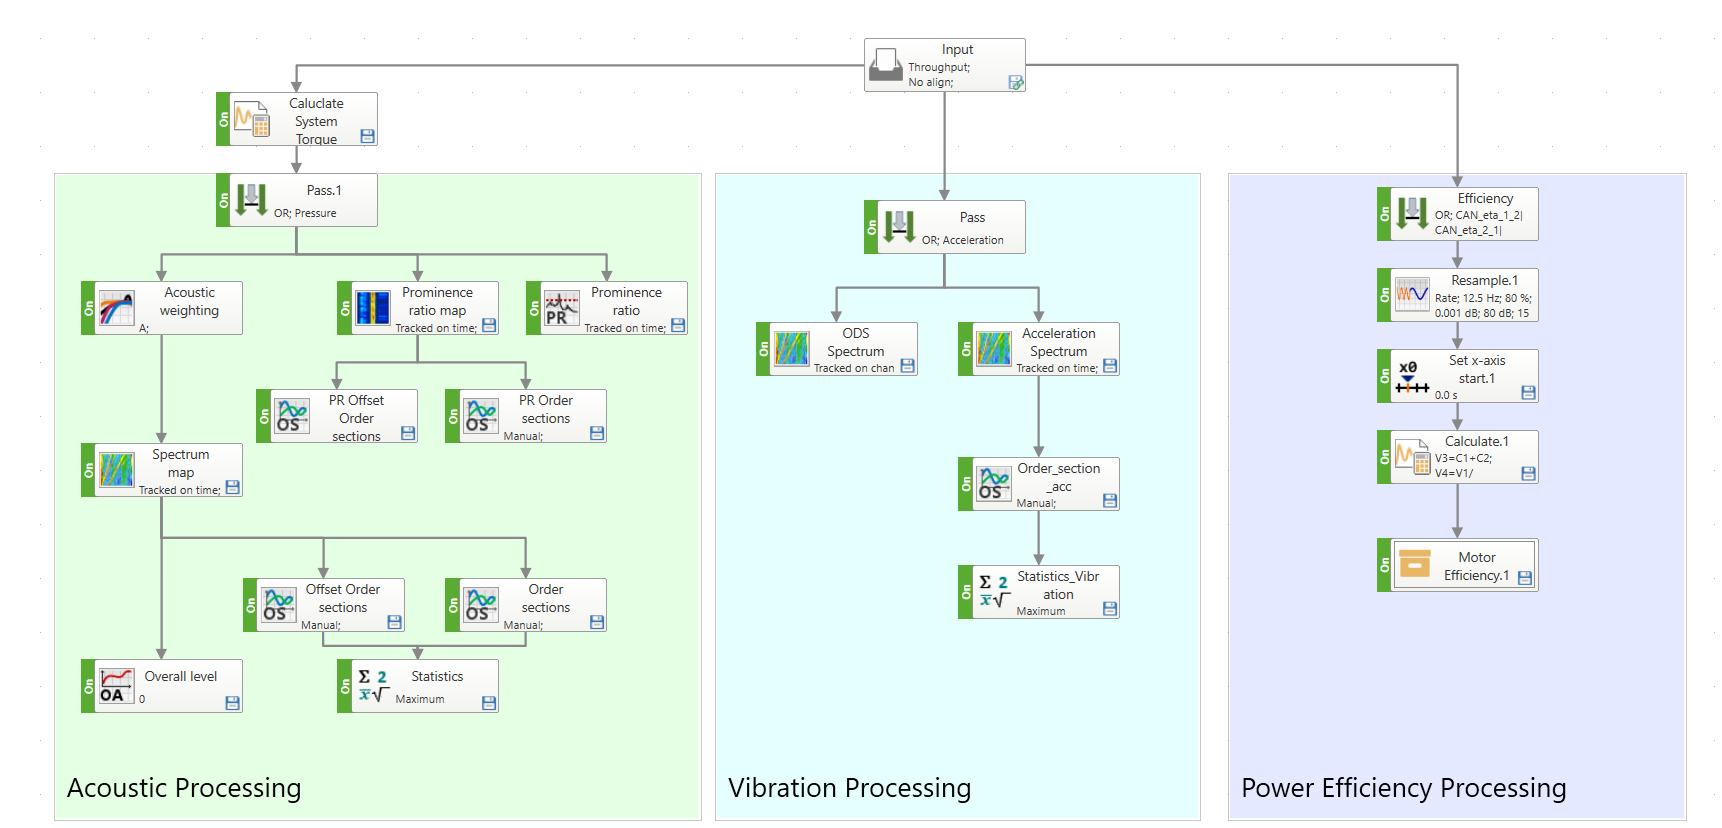
Once acquired, the data is processed in three parallel streams within Simcenter Testlab Process Designer.
The acoustic pipeline filters the microphone pressure data and computes psychoacoustic metrics, most notably the Prominence Ratio. Order sections and offset order sections are extracted, A-weighting is applied, and the outputs include auto power, overall noise level, and order section maxima.
The vibration pipeline processes the accelerometer data to generate Operational Deflection Shape (ODS) spectra including phase information, alongside auto power spectra, order sections, and their maxima.
The efficiency pipeline handles the CAN-streamed data from the power analyzer and mechanical power calculation, based on rotational speed and torque. The data is first downsampled to the CAN data rate and the x-axis is reset to zero.
Visualizing the results
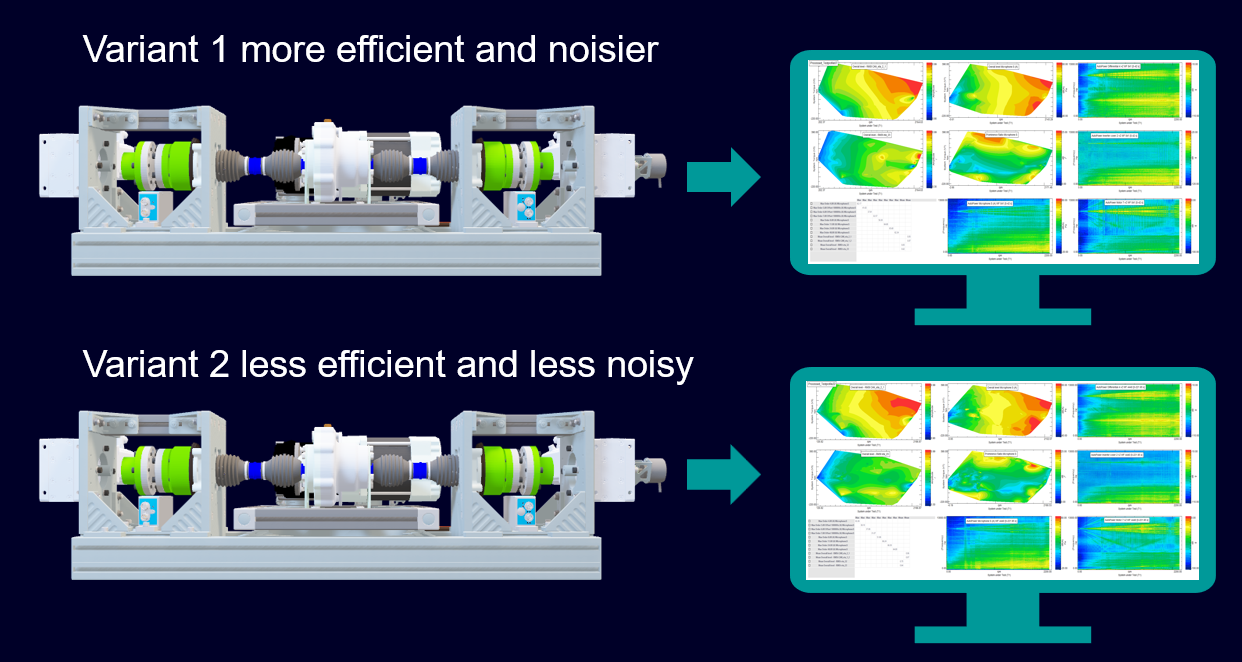
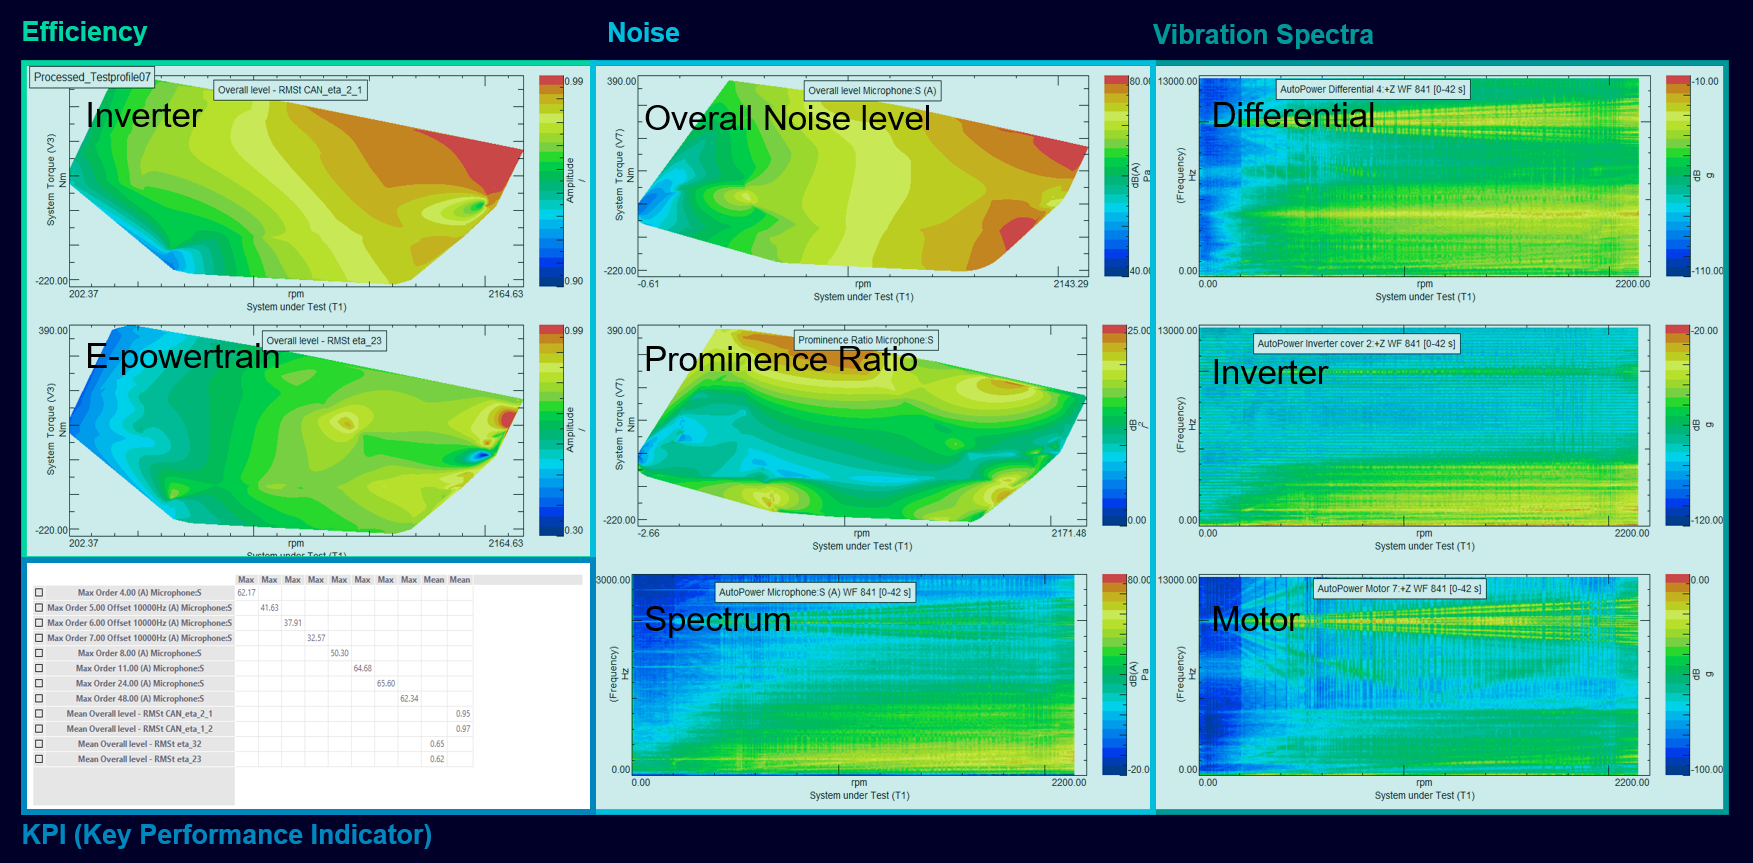
With the processing pipeline in place, results can be applied to any new measurement in just a few clicks. The dashboard brings together point cloud data for motor and inverter efficiency, overall sound power level, prominence ratio maps, and accelerometer and microphone spectra — all in one view, ready for KPI evaluation.
Results — Balancing the trade-off
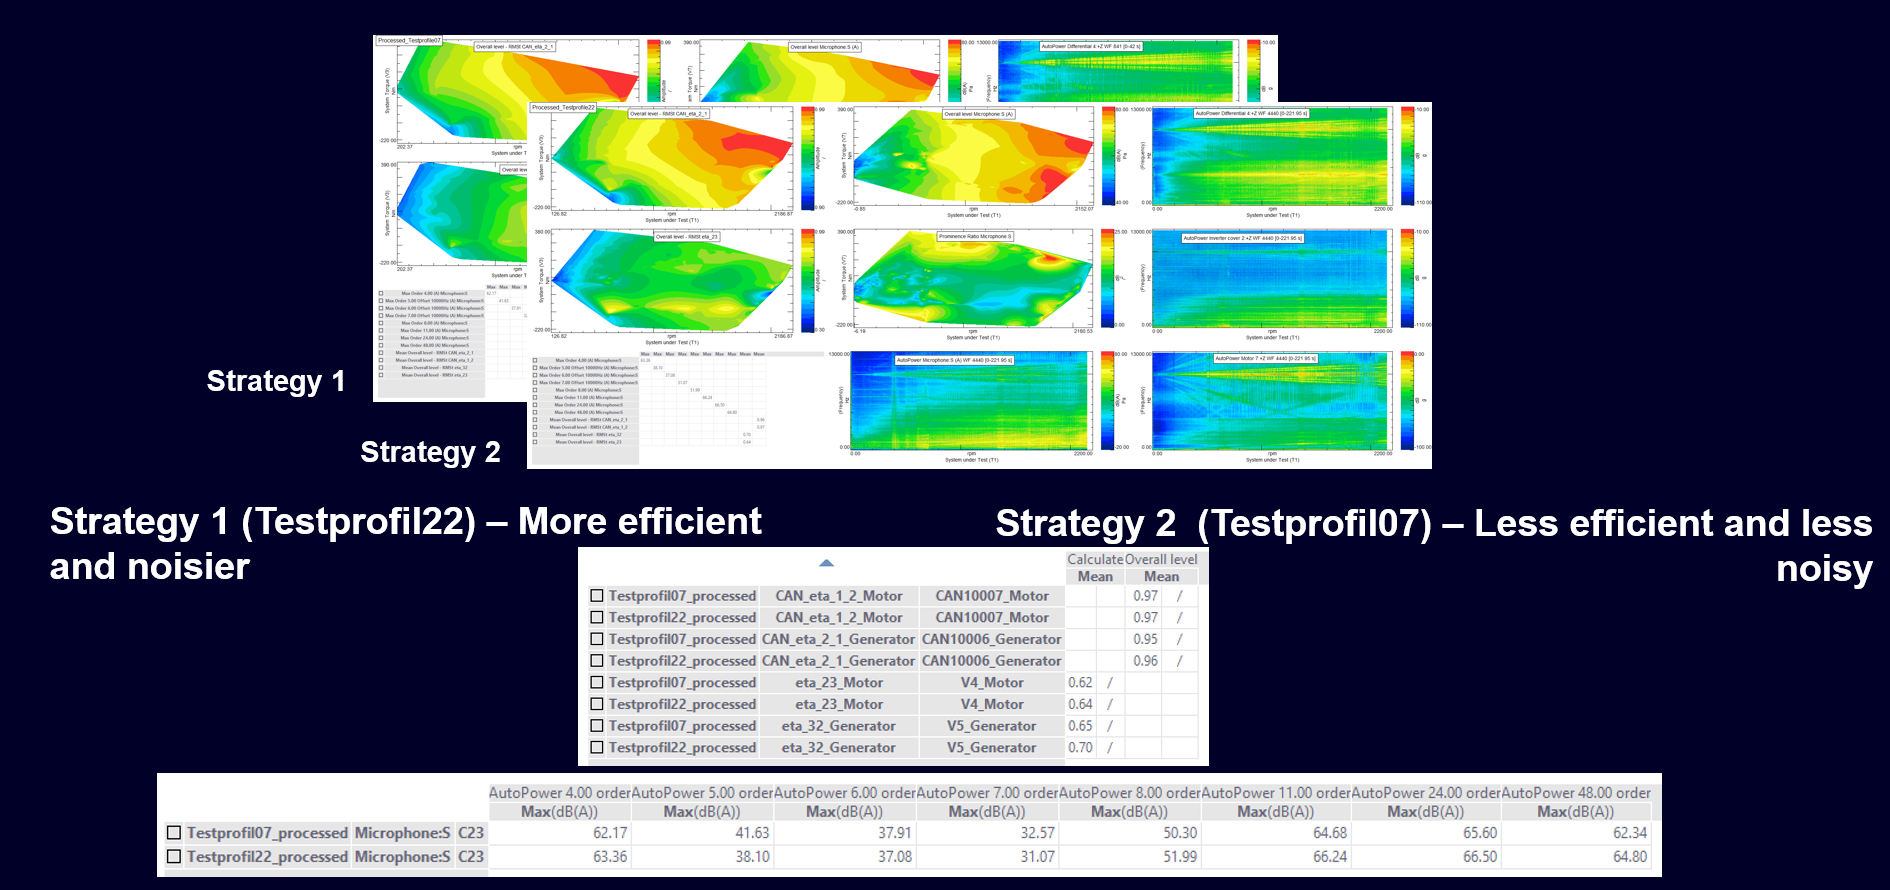
Two test profiles were evaluated — Testprofil07 and Testprofil22 — representing two different control strategies. Strategy 1 is more efficient, while Strategy 2 is quieter. This is the classic trade-off, and the question is straightforward: is the efficiency gain of Strategy 1 worth the NVH penalty?
Identifying critical orders
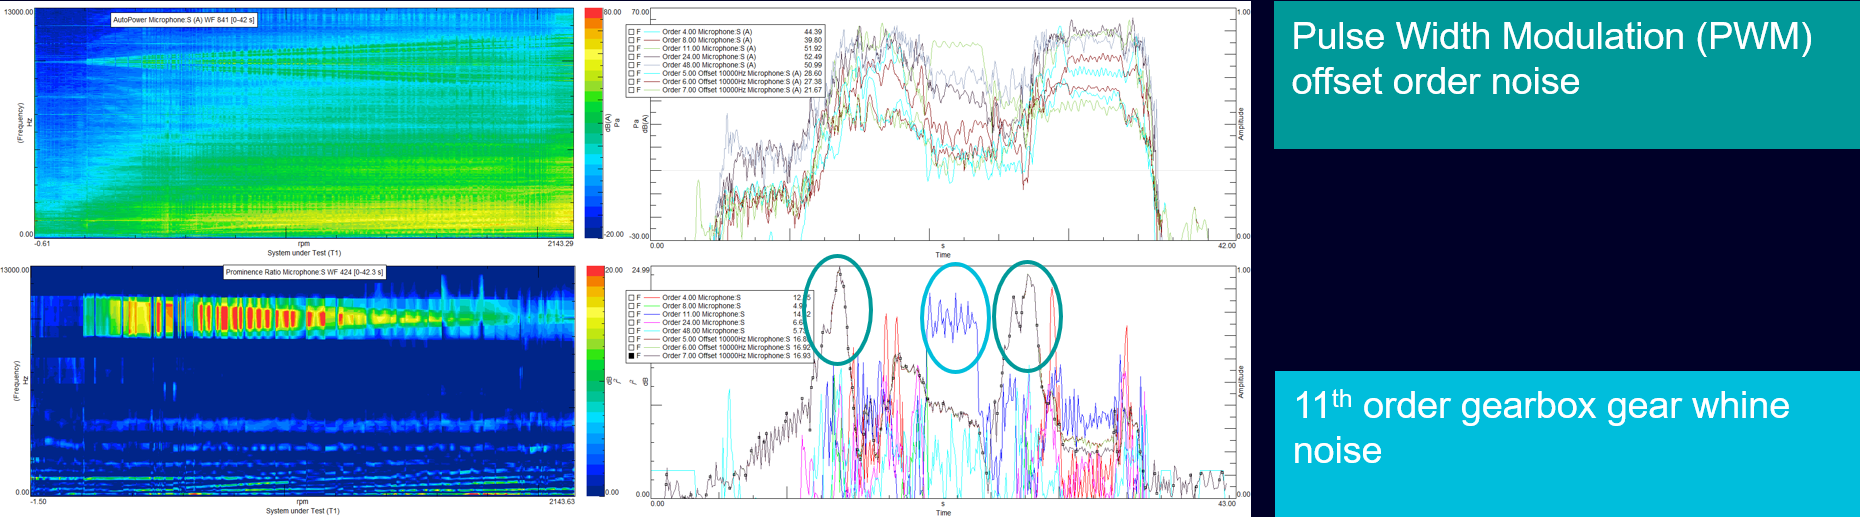
Order analysis makes it straightforward to pinpoint the noise sources. The 11th order corresponds to gearbox whine and appears during energy recovery when the motor operates in generator mode at low rotational speed. The 24th and 48th orders are linked to the e-motor and the off-set orders are due to the Pulse Width Modulation (PWM). The results view presents the microphone spectrum and prominence ratio map on the left, with the critical order cuts — orders 4, 11, 24, and 48 — shown on the right for direct comparison between strategies. We see the most critical orders appearing in the prominence ratio order cuts. PWM orders and the 11th order gear whine are most ciritcal.
When does the noise appear?
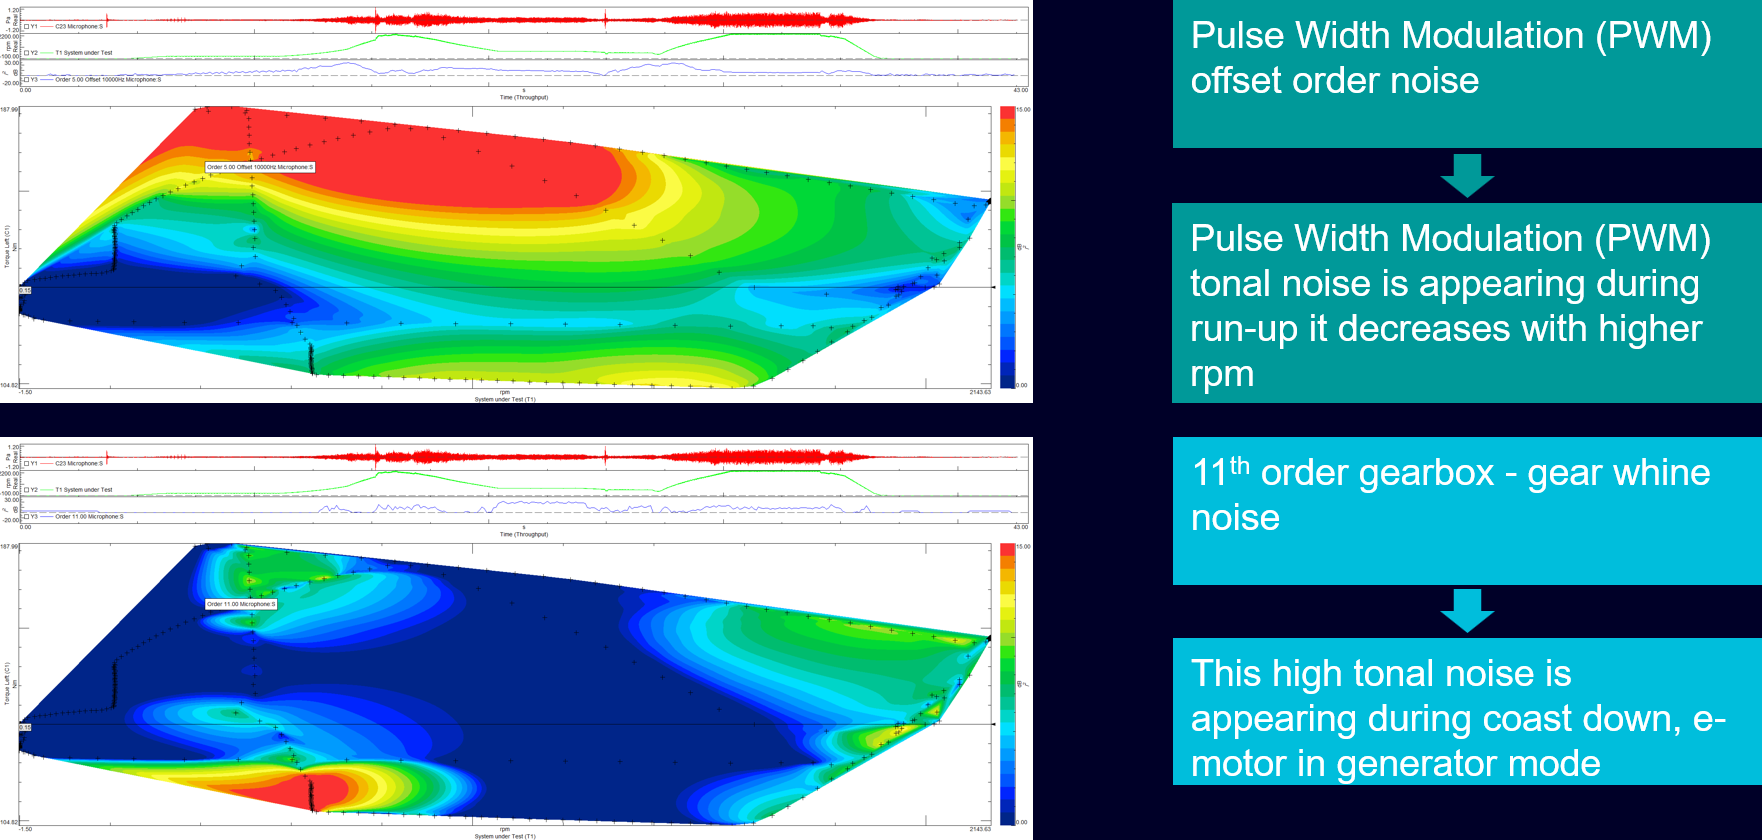
By mapping noise events against operating conditions, the picture becomes even clearer. PWM-related noise occurs at low-to-mid rotational speeds under high positive torque, while the 11th order gearbox whine appears specifically during energy recovery at low RPM. This level of detail allows engineers to make informed decisions — not just about which strategy performs better overall, but about exactly where in the operating map the trade-off is acceptable.
Audio replay with filtering adds a final, intuitive layer — engineers can listen directly to the isolated noise contributions, complementing the numerical data with a perceptual check.
Conclusions
Let’s bring it back to where we started — multitasking.
Developing an e-powertrain means balancing multiple physics simultaneously. Efficiency, NVH, mass, cost, and reliability are all interconnected, and optimizing one without watching the others is not an option. By measuring efficiency and NVH in a single, synchronized test, separate test campaigns become unnecessary — saving time while ensuring the two datasets are directly comparable. The integration of Simcenter Testlab and Simcenter SCADAS with the ZES Zimmer power analyzer enables a fully automated, repeatable processing pipeline that can be set up once and applied to every subsequent measurement. Order analysis and psychoacoustic metrics then allow engineers to pinpoint exactly when, where, and why noise occurs — turning the efficiency-NVH trade-off from a problem into a well-understood design space.
The trade-off was never the obstacle — the missing piece was simply having the right hardware equipment and software to navigate through it.
Want to go deeper?
- 🔗 Learn more about Operational Deflection Shapes (ODS)
- 🔗 Explore automatic testing, data management upload, and storage
- 🔗 Dive into NVH prediction, blocked force measurements, and mount stiffness characterization