Automated processing of measurement data – get rid of repetitive tasks
Let’s talk about processing measurement data. Repetitive tasks are not just a drain on time and resources, but they are also frustrating and prone to human errors. It is evident how easily mistakes can occur when the concentration level drops. In the end, who likes to do repetitive work today?
Imagine you are comparing two sets of data – one processed a week ago and the other measured recently. Unfortunately, the new results don’t look good. Specifically, the noise level emitted by the powertrain is increasing, due to a new control strategy. If this is confirmed, it is important to investigate and potentially resolve this noise issue. However, there are common questions you will ask yourself in such situations. Have I processed the data in the same manner as before? Did I make any mistakes during the measurements or the processing? You need to answer the above questions first before addressing the actual issue. The less time wasted on the above questions, the more efficient we can be in solving the actual problem.
In this blog, I will show you how to process data thanks to the Simcenter Testlab Process Designer. But let us first present the e-powertrain demo testbench.
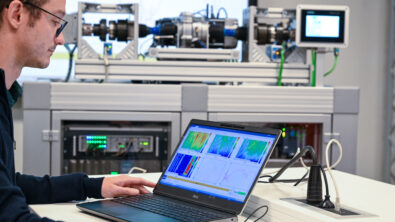
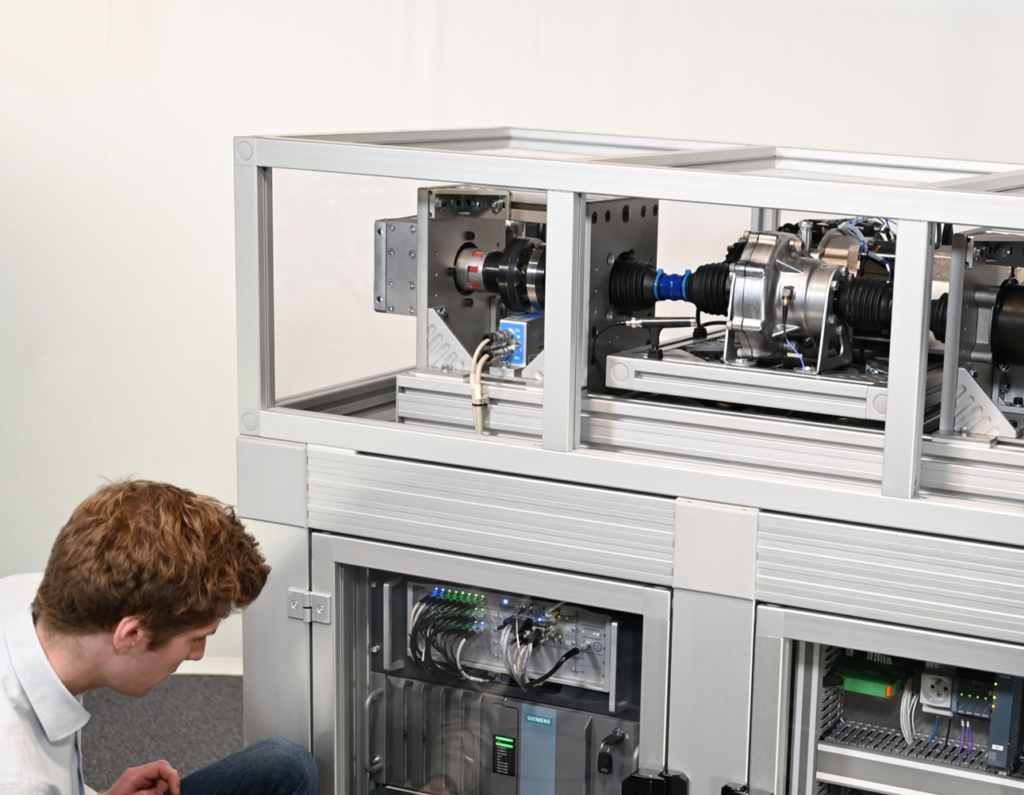
E-powertrain testbench
The e-powertrain testbench consists of an e-drive with an e-powertrain, inverter, battery, two load motors, and several sensors (see image below).
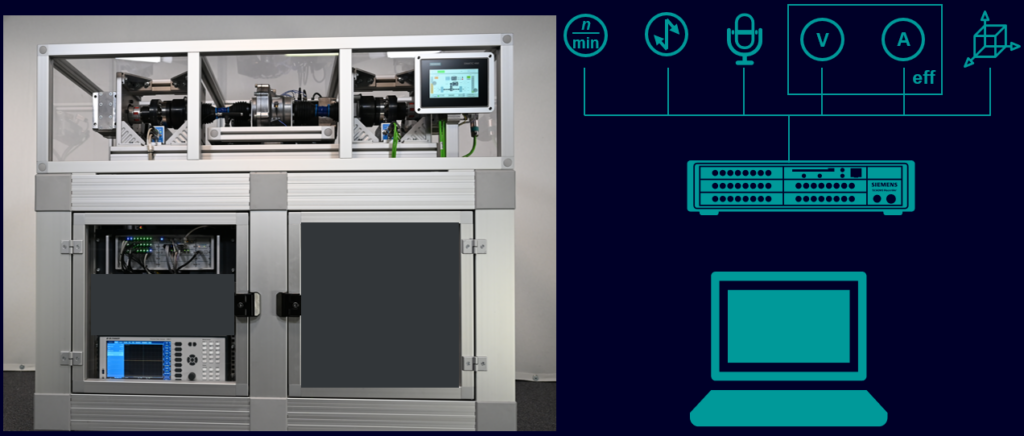
As sensors for the e-powertrain, we use several accelerometers, one on the gearbox and one on the inverter, and eight on the e-motor; one microphone is placed close to the gearbox, torque and rpm sensors, and current and voltage sensors are additionally used.
In the above figure, we see that 2 data acquisition systems are used. The Simcenter SCADAS Mobile acquires NVH-related data, and the power analyzer measures voltage and current data. The power analyzer provides efficiency and power data to the Simcenter SCADAS Mobile through CAN. For this kind of data, a low-frequency sampling rate is fine.
Simcenter Testlab Process Designer in a nutshell
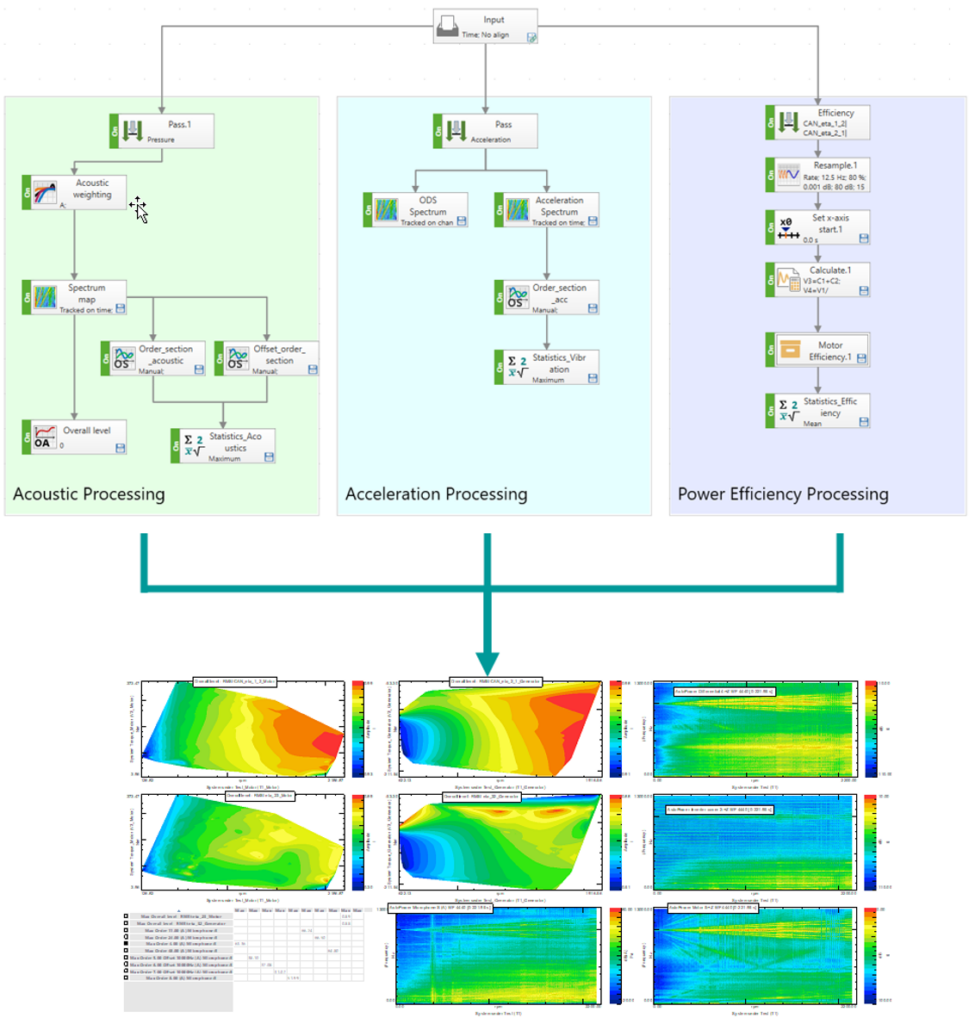
Processing our measured data after each measurement can be time-consuming. Therefore, we decided to use Simcenter Testlab Neo, in particular Process Designer, which allows us to chain methods in a simple, graphical way. In our example, we are processing different kinds of data in parallel,
- acoustic data
- acceleration (vibration) data and
- power efficiency data, see the image below.
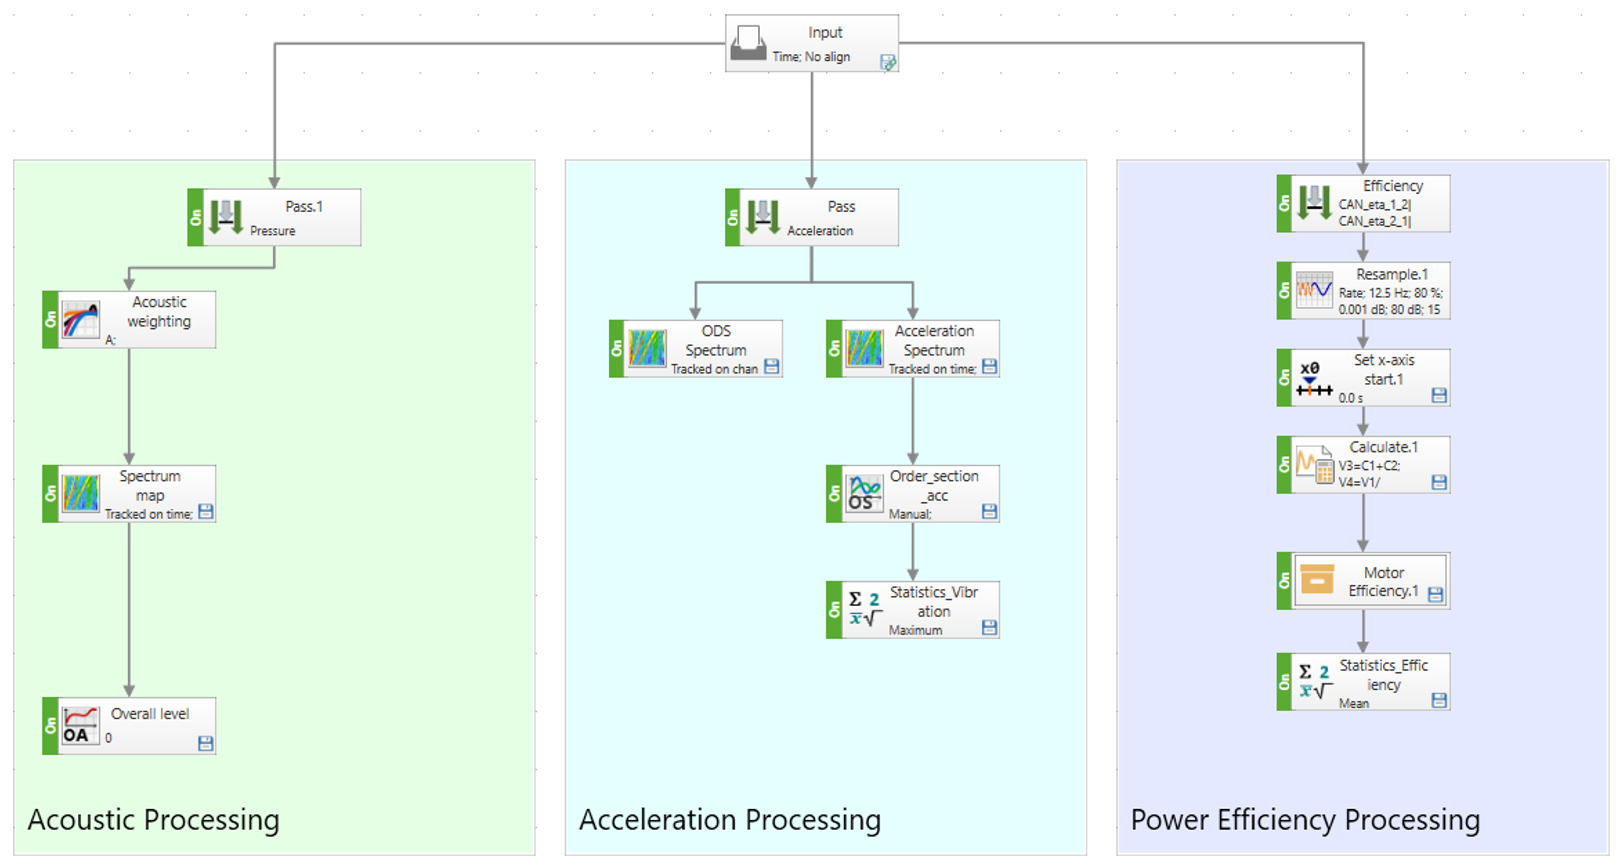
The video explains the different process blocks.
Process manipulation and data processing
It is very easy to create this process. One can simply drag and drop the desired methods in the process pane and connect them together. In the video below, we add order sections and the statistics method for KPI (Key Performance Indicator) evaluation. Once we have created the process, we can load the measurement data in the input basket and start the processing. The pivot table allows us to visualize the data within a few clicks, including spectrum maps, order sections, and KPI.
Data comparison
Now I have been writing about repetitive work. You might say yes, but until now, we had to prepare each of the steps one by one. Why would we do all that, this sounds pretty much like annoying work. Imagine we are now measuring different drive train variants, like different control strategies. We would like to compare the results of all variants. Exactly this is a strong part of Simcenter Process Designer. Each process can be stored and reused to evaluate each measurement exactly in the same way. But this not all, once we have processed the data, we would like to visualize in a clean and simple way. This is shown in the below figure.
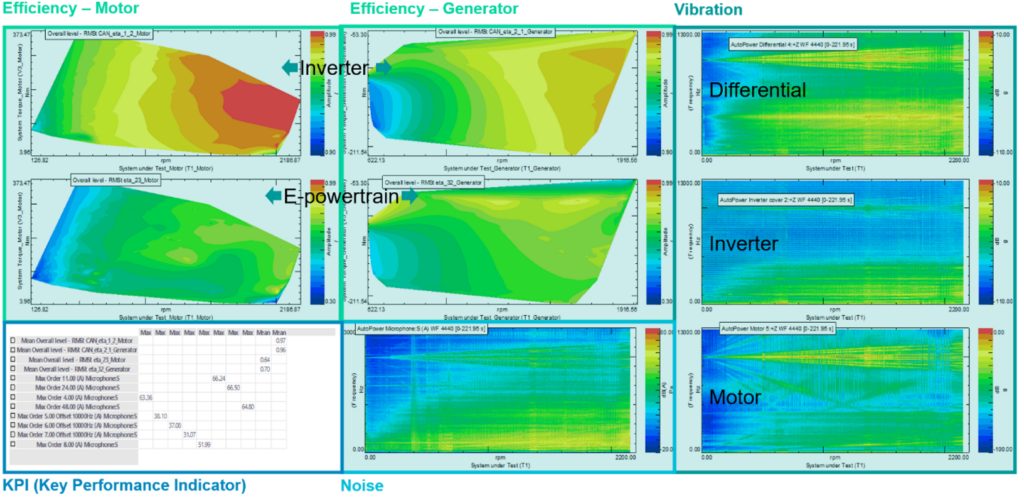
When visualizing efficiency, it will be shown for torque over RPM, here motor and generator efficiency blocks are separated. See below how one can create such a view.
The overview of the e-powertrain shows the efficiency maps, vibration, and noise spectra for differential, inverter, and motor. Additionally, KPIs are visualized. Those are the mean efficiency values for Inverter and e-powertrain, motor and generator mode, and maximum noise levels per order.
Switching now with queries between the different measurements is very easy, as in the video below.
And this is what we get at the end: We can compare different strategies in the form of Spectrograms, KPIs, and more. In the image below, we see 2 different strategies for different control scenarios.
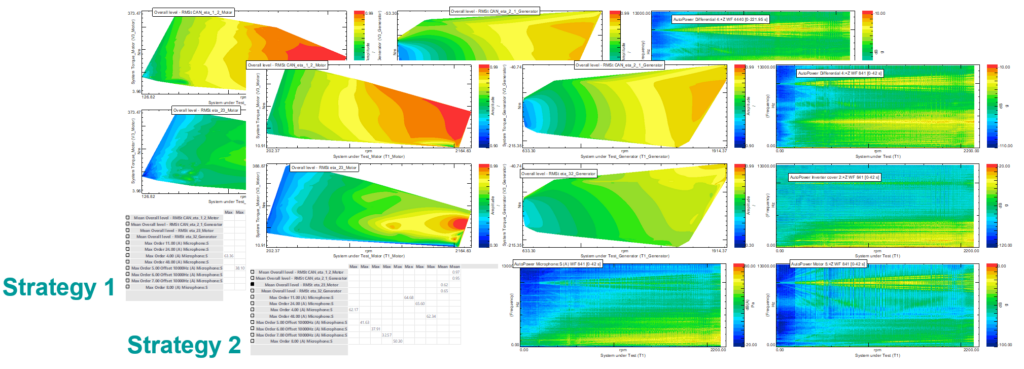
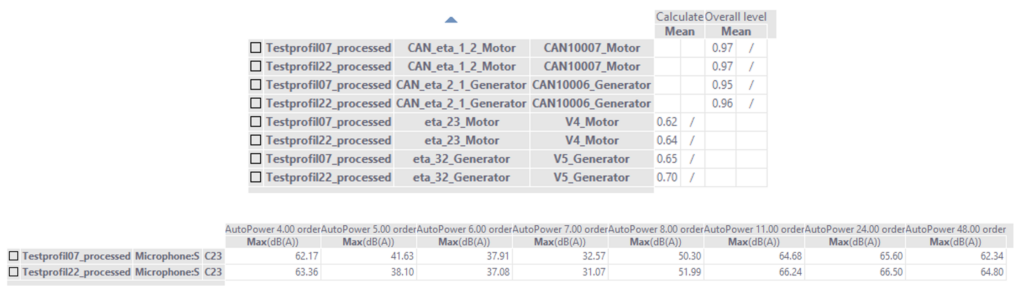
Efficiency level and noise level can be compared in detail with a few clicks.
In our results, strategy 2 (Testprofil22) is more efficient but also noisier than strategy 1 (Testprofil07).
Are we done? For the moment, yes, but what if we would like to investigate whether the increased noise level is an issue and where it is coming from?
What can we do next?
- Psychoacoustic analysis – e.g. prominence ratio;
- Order cuts for prominence ratio;
- Audio replay and filtering;
- Sound camera to identify the critical area;
- Modal testing;
- …
Please don’t hesitate to contact us for further questions: markus.brandstetter@siemens.com.
Are you interested in the data acquisition part of this e-powertrain? Read the blog below:
Do you want to learn more about Simcenter Testlab Process Designer?


