How to simulate liquid cooling and energy systems for an AI data center

This study uses Simcenter Amesim to model a 5.22 MW liquid-cooled AI data center pod together with its cooling plant, solar PV system, battery storage and grid connection. Annual simulations across Lyon, Malaga and Oslo show how climate changes chiller use, water consumption, PUE and the economic performance of different PV and BESS configurations. Among the evaluated scenarios, PV100 with eight hours of battery storage produced the lowest modelled 15-year cost. Results depend on the stated technical, tariff and cost assumptions and should be treated as scenario comparisons rather than universal design recommendations.
What did the data center liquid cooling simulation reveal?
- How much does climate really change data center performance?
- Is more solar capacity always the better choice?
- When does more battery storage stop adding value?
- Can enough solar generation make an AI data center self-sufficient?
- Which combination delivers the strongest economic case?
- Why model cooling and power as one integrated system?
Introduction
The rapid increase in AI compute density is driving a transition from conventional air-cooling architectures toward direct liquid cooling. Rack powers exceeding 100 kW are becoming commonplace, creating strong interactions between cooling system design, electrical infrastructure, and site energy management.
In parallel, data center operators are increasingly evaluating on-site renewable generation and battery energy storage systems (BESS) to reduce grid dependency, improve energy resilience, and mitigate operating costs.
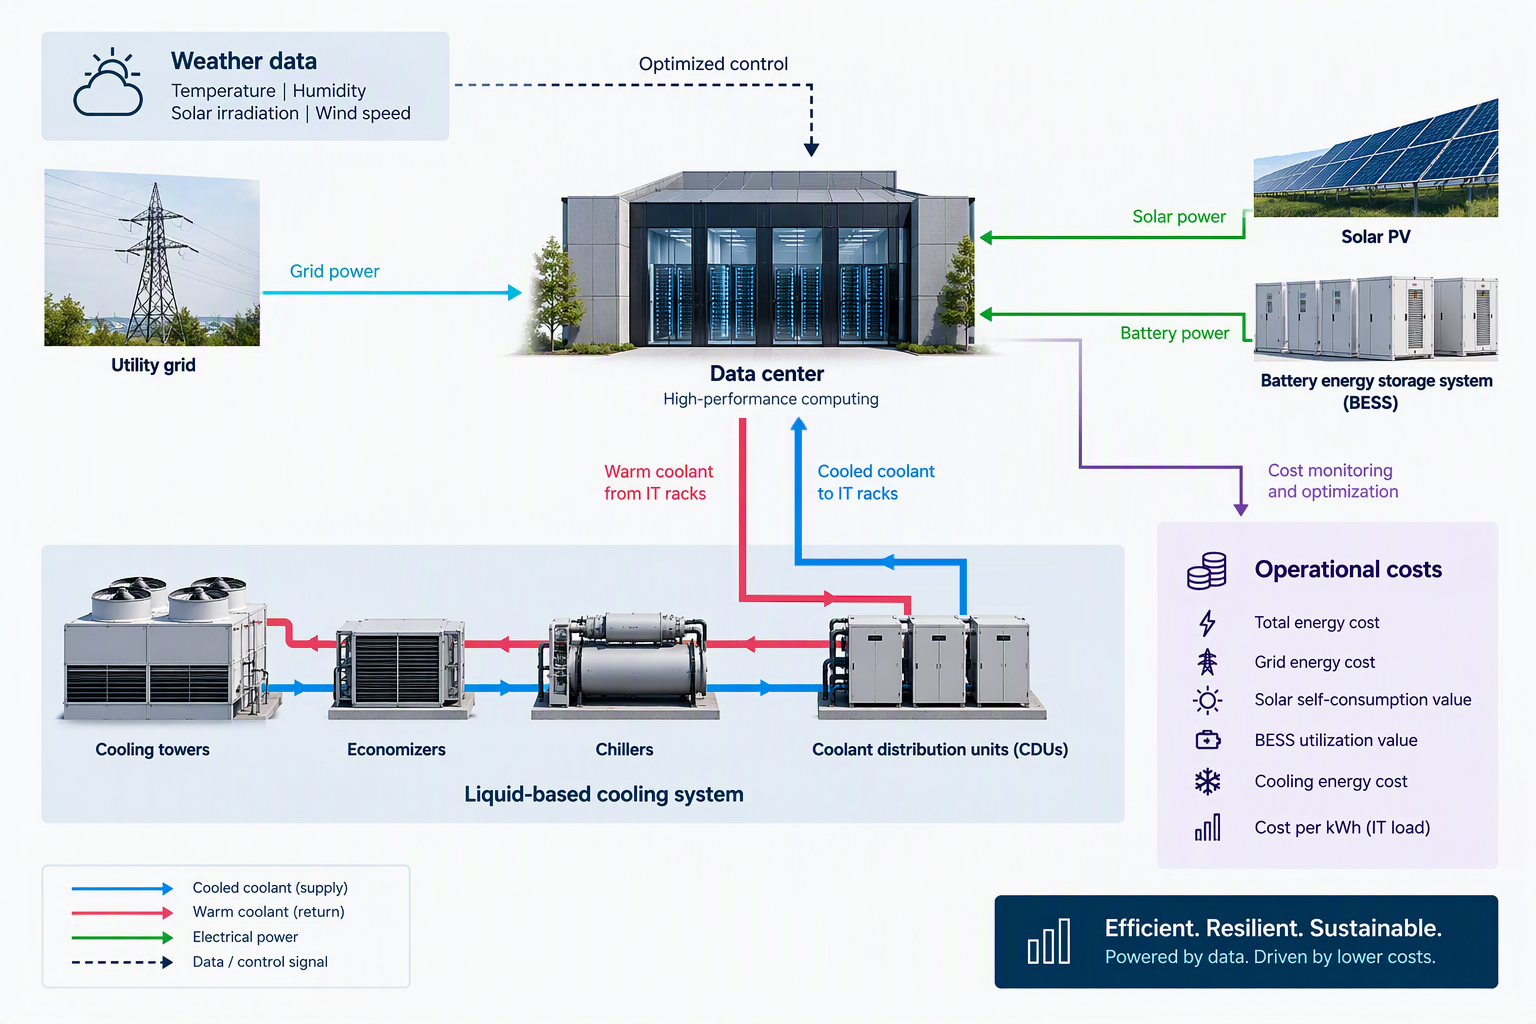
This study presents the functional modeling and annual simulation of a high-density liquid-cooled data center pod using Simcenter Amesim. As illustrated by the figure above, the system integrates the following main elements:
- Direct liquid-cooled (DLC) racks
- Coolant Distribution Units (CDUs)
- A chiller-economizer subsystem
- Cooling towers using dry and wet heat rejection technologies
- Grid-connected photovoltaic plant
- Battery energy storage (BESS)
- Weather-dependent operation
This system-level simulation framework is used to assess both technical and economic performance across multiple climates and energy infrastructure configurations.
System model description
Compute Infrastructure
The system analyzed is representative of a pod consisting of 36 high-density 145 kW AI compute racks. This makes a total IT load of 5.22 MW.
A corresponding typical AI data center would consist of 20 pods, thus representing a total IT load of about 100MW.
The IT load is represented by a repeating 24-hour transient load profile to capture realistic daily demand fluctuations. The profile used in this study is representative of a mixed 70% training / 30% inference IT load profile, as illustrated on the figure below:
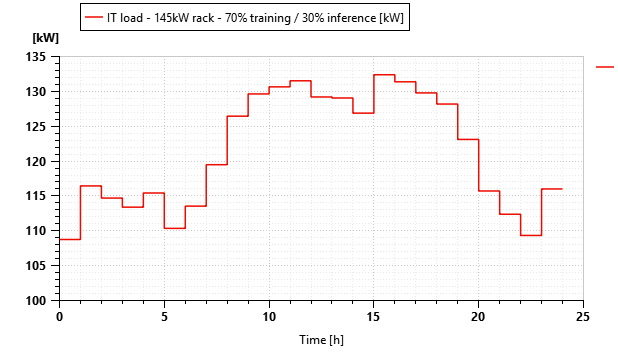
Annual simulations are performed with sub-hourly energy balance calculations while preserving long-term seasonal effects.
Cooling System Architecture
The cooling plant is represented through a multi-domain thermal-fluid functional model as illustrated in the figure below:
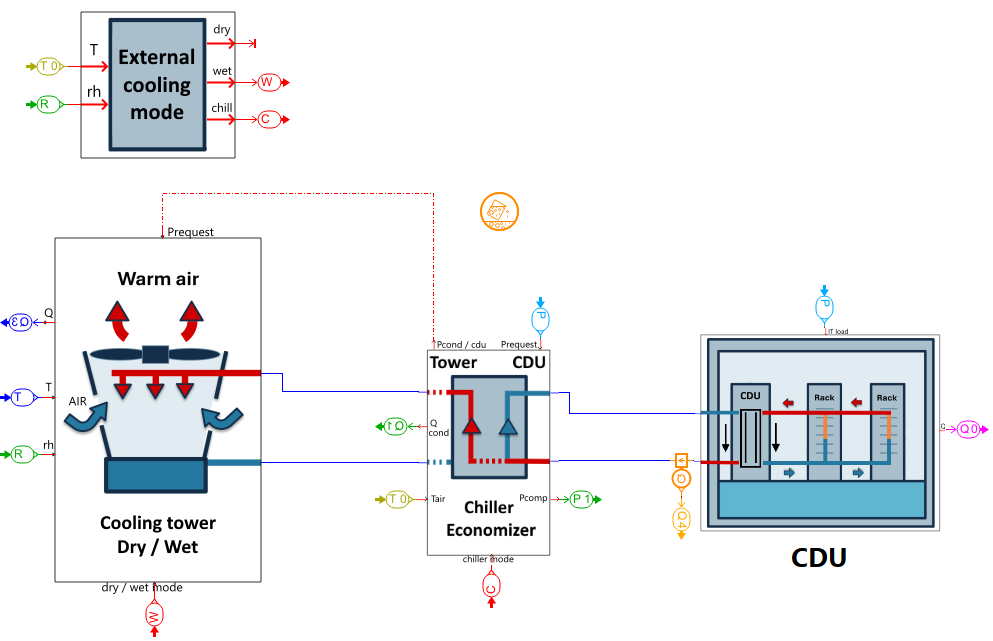
- CDU:
The CDU (Coolant Distribution Unit) connects the liquid-cooled racks with the FWS (Facility Water System).
The model is representative of an ASHRAE S30 TCS (Technology Cooling System) fluid class, thus meaning that the rack inlet coolant temperature is set to 30°C.
We have considered a 10°C temperature increase across the racks, thus leading to a rack outlet temperature of 40°C.
The CDU approach temperature has been set to 4°C, thus corresponding to a FWS supply temperature of 26°C.
- FWS:
In the Facility Water System, the chilled water to the CDU is a Chiller / Economizer subsystem.
- Chiller:
- the chiller power consumption is based on a real thermodynamic cycle considering 1234ze refrigerant
- the evaporating temperature is set to TFWS supply – 2°C = 24°C
- the condensing temperature is set to max(44, Tambient +10)°C
- an isentropic efficiency of 0.7 and a mechanical/electrical efficiency of 0.9 is used for the compressor
- Economizer:
- the chiller is by-passed when the ambient temperature is below a threshold set to 20°C
- in that case, the water coming back from the CDU is directly sent to the cooling tower
- Cooling tower:
- operates in both dry and wet modes
- dry mode is activated when Tambient ≤ 20°C
- wet mode is activated when Tambient > 20°C and Tbulb ≤ 20°C
- when the tower operates in wet mode, the water consumption is calculated from the evaporation and a drift loss of 0.01%
- Pumps / fans / pressure drop: for power consumption calculations:
- an overall pump efficiency has been set to 0.85
- an overall fan efficiency has been set to 0.7
- constant water pressure drops have been assigned to the racks and CDU/Chiller/economizer, respectively 50 kPa and 35 kPa
- a constant air pressure drop of 200 Pa has been assigned to the cooling tower
As can be seen later in the results section, the annual chiller runtime provides a direct indication of climate-dependent energy efficiency.
Electrical System Architecture
The electrical infrastructure is represented using a DC-equivalent power distribution model.
The following elements are connected to this single bus:
- Utility Grid: as a constant voltage source, thus enabling to account for in and out powers to maintain the bus voltage
- Load: as an addition of the IT load, the cooling system power consumption as well as UPS + PDU + lighting load accounted for 8% of the IT load
- Solar Panels: sized as described in the next paragraph
- BESS (Battery Energy Storage System): sized as described in the next paragraph
- Efficiencies of DC/DC converters have been set to 0.9
The DC bus simplifies the representation of bidirectional power exchanges while preserving overall energy conservation and conversion efficiencies.
Note that in this case, the power quantities should be considered rather than the voltage and current values individually.
Solar Photovoltaic System and Battery Energy Storage System
- PV panels:
A manufacturer datasheet [1] of a 500Wp base panel with detailed specifications has been used in this study as a reference pattern. Each panel has a surface of 2.21m2.
The model used considers the impact of irradiance as illustrated in the figure below as well as the temperature.
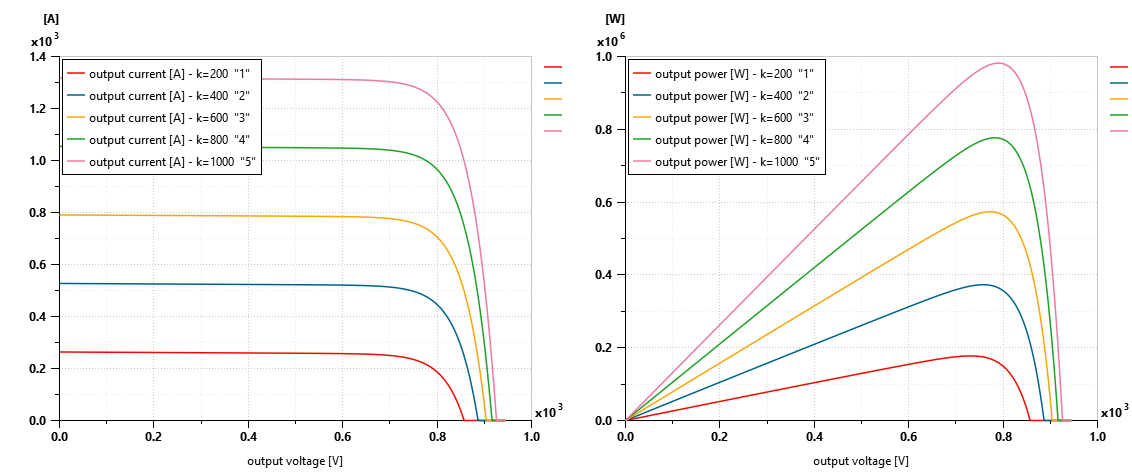
Photovoltaic generation is computed using site-specific solar irradiance data.
Different global PV panels plant sizing will be studied in this work.
- BESS:
The BESS base module is a 45Ah LFP cell taken from the Simcenter Amesim battery database.
The pack architecture is then defined according to the required capacity. We consider as a base architecture a 720 kWh battery pack made of 250 cells in series (800V) and 20 in parallel (900Ah).
Multiple battery capacities are evaluated to determine their impact on renewable utilization and operating cost reduction.
Climate and Weather Modeling
A complete year of weather data is used for all simulations.
Environmental inputs include:
- Dry-bulb temperature
- Relative humidity
- Global irradiance using an optimal PV inclination angle [2] depending on the location
Three representative climates are considered and extracted from [3] for year 2023:
- Lyon, France, as a temperate climate (optimal PV inclination = 37°)
- Malaga, Spain, as a hot Mediterranean climate (optimal PV inclination = 35°)
- Oslo, Norway, as a cold Nordic climate (optimal PV inclination = 44°)
The objective is to capture the combined influence of climate on:
- Cooling demand
- Economizer availability
- Chiller performance and usage
- Solar generation potential
- Battery utilization
At the end, this impact is translated into
- data center PUE (Power Usage Effectiveness = total energy / IT energy)
- costs
Simulation scenarios
A parametric study is performed combining PV sizing and BESS sizing for the 3 above-mentioned geographical locations.
PV Sizing basic principle
For the initial sizing of the PV plant, we use the following data and assumptions:
- PV average production (Eaver) for the given location (data given by PVGIS [2])
- Lyon: 1330kWh per kWp installed
- Malaga: 1752kWh per kWp installed
- Oslo: 990kWh per kWp installed
- Considering daily solar production during 8h, we can estimate the installed PV power needed to produce 1kW over 24h:
- Ppow = 3/(Eaver/365/8)
- Let’s now estimate the average power load (from IT load with a PUE of 1.1 and nominal power = 90% of rated power):
- Pload = 1.1* rack_number * 145 kW * 0.9 = 5170 kW
- PV installed power: considering an energy shifting scenario (labeled PV100), i.e. 100% of the annual energy consumption being produced by solar panels, the installed power needed is given by Ppow * Pload (no losses are considered here specifically):
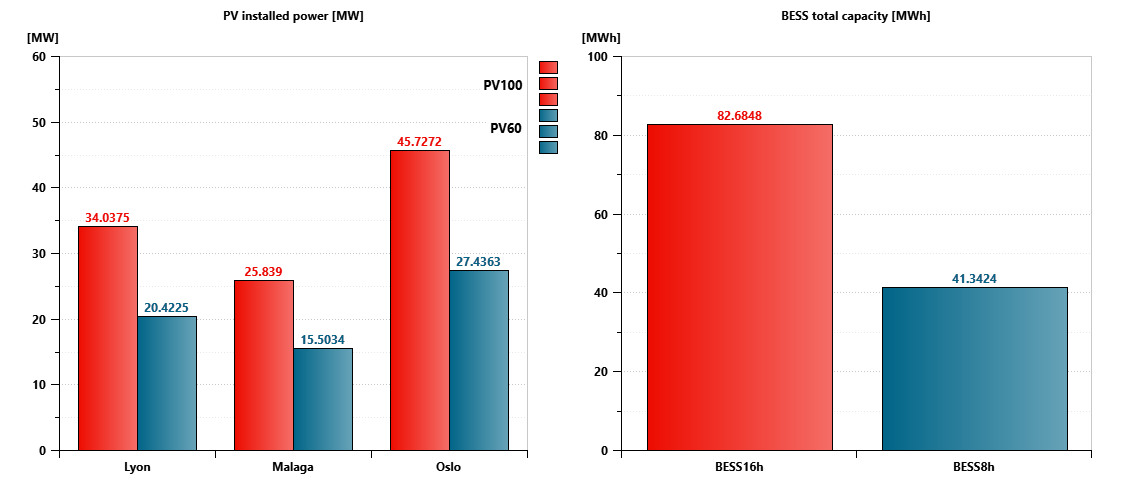
- Lyon: 34 MWp
- Malaga: 25.8 MWp
- Oslo: 45.7 MWp
Because of solar availability for only around 8 hours a day, BESS needs to be integrated into the system to store the energy needed for the remaining 16h.
BESS Sizing
As described above, energy shifting is one of the sizing scenarios, but other ones are commonly studied:
- Peak shaving
- Renewable energy buffering
We often size the BESS in terms of target runtime.
Considering for instance a 16h target runtime, we use the average power load that we multiply by 16, hence BESS16h = 82.7MWh; for an 8h target runtime, BESS8h = 41.3MWh
In the present study, the design space is based on 2 PV powers and 2 BESS capacities. The resulting design space enables systematic investigation of cooling-energy interactions and infrastructure trade-offs.
Design space:
- 3 locations: Lyon, Malaga, Oslo
- PV100, PV60 (PV60 = 60% of PV100)
- BESS16h, BESS8h
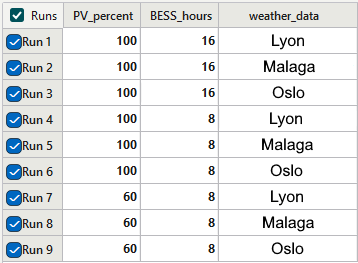
Note that the scenario PV60 BESS16h was excluded from the design matrix, considering that for this case the battery energy storage is theoretically oversized and unable to be used at full capacity because of PV limited installed power.
Energy management
In the model, a very simple energy management system has been implemented.
It consists in:
- Directing Solar Production in priority to the load (IT + cooling + others)
- Charging the BESS when in excess
- Sending the rest to the grid when the BESS reaches 100% SOC
BESS discharges entirely to the load when no solar power is available until reaching 10% SOC
Note that the initial BESS SOC is set to 19%.
Results and Performance Indicators
Different performance indicators can be extracted from the simulation run for different scenarios.
Thermal Performance
- Annual cooling energy
- Economizer and chiller usage
- Cooling tower water consumption
Electrical Performance
- Grid imports and exports
- Solar generation
- Battery throughput
- Self-consumption and self-sufficiency ratios
Data Center Efficiency
- Annual PUE (Power Usage Effectiveness)
- Seasonal PUE evolution
Economic Assessment
A first-order techno-economic model is integrated into the simulation workflow. Elements are taken from references cited at the end of the document. Otherwise specified, data are given for Europe within a 2025-26 period. Regarding the electricity tariffs, they are valid for France but will be applied for the 3 locations similarly.
sdfsd
Inputs include:
- PV CAPEX [5]: 700 €/kWp
- BESS CAPEX [4]: between 640 – 800€ kWh (respectively for 10 MWh and 1 MWh total installation)
- Electricity tariffs (VAT excluded) based on EDF professional pricelist [6]
These tariffs include:- A fixed subscription part 31625 €/1000kVA
- 5 different prices per kWh:
- Winter day 0.1688 €/kWh
- Winter nights & Sundays 0.1224 €/kWh
- Summer days 0.1033 €/kWh
- Summer night & Sunday 0.0941 €/kWh
- Peak (15h in winter) 0.2344 €/kWh
- Resell electricity price 0.09 €/kWh
Outputs include:
- Annual energy cost for the first year and following ones
- Energy-related operational cost (OPEX)
- Energy-related Investment requirements (CAPEX)
- Simple break-even period
- Energy flows (Sankey diagrams)
Note that the techno-economic model is highly simplified and does not include any battery, PV or cooling system degradation, no maintenance costs, no financing, discount schemes or incentives, no energy price daily fluctuations or detailed elements that would constitute a real analysis.
Key Engineering Questions
The simulation framework is designed to address several practical design questions:
- How does climate influence annual cooling efficiency?
- What fraction of cooling energy can be offset through economizer operation?
- How much PV can be effectively utilized without storage?
- What is the incremental value of battery capacity?
- Under which climatic conditions does wet cooling provide a meaningful benefit?
- How do CAPEX and OPEX tradeoffs vary across locations?
Results
As previously mentioned, a comprehensive set of results can be extracted from the simulated scenarios. An extract of it is proposed hereafter.
- PV installed power and BESS capacity
Before looking at some of the key results, let’s have a look at the Solar PV installed powers and BESS capacities used in this study
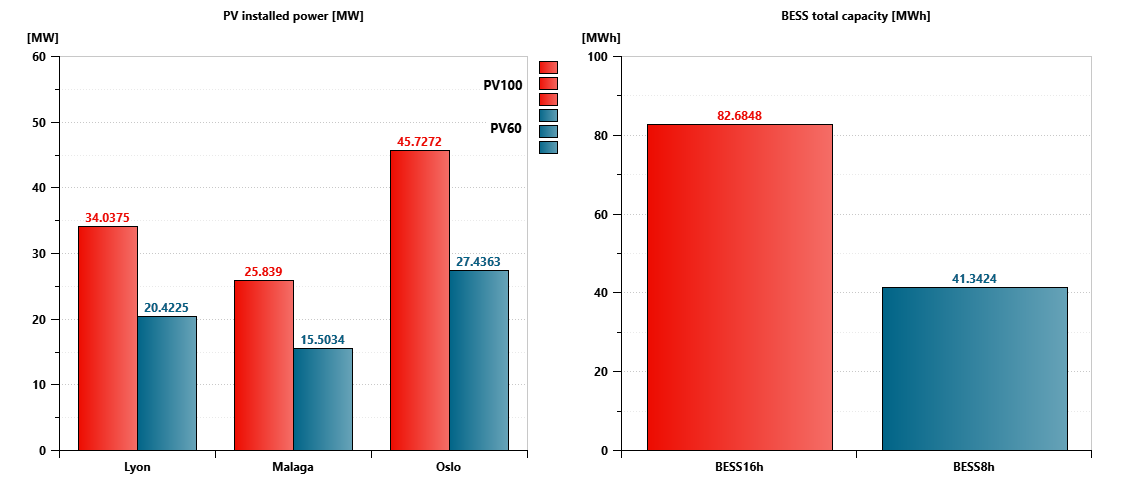
Let’s start with elements independent from the PV and BESS sizing scenario but characteristics of each location.
- PUE, cooling operation mode and water loss
The PUE is a key metric for data centers since it represents its energy efficiency. The Uptime Institute Global Data Center Survey 2026 revealed an industry-wide annual average PUE of 1.52 [7]. Leading hyperscale data centers (such as Google and Huawei-managed facilities) can achieve a PUE below 1.10 [8].
In the model proposed, the PUE does not take into account for power transfer efficiency between the main energy supply and the IT load (accounted for 90% in the global energy balance though).
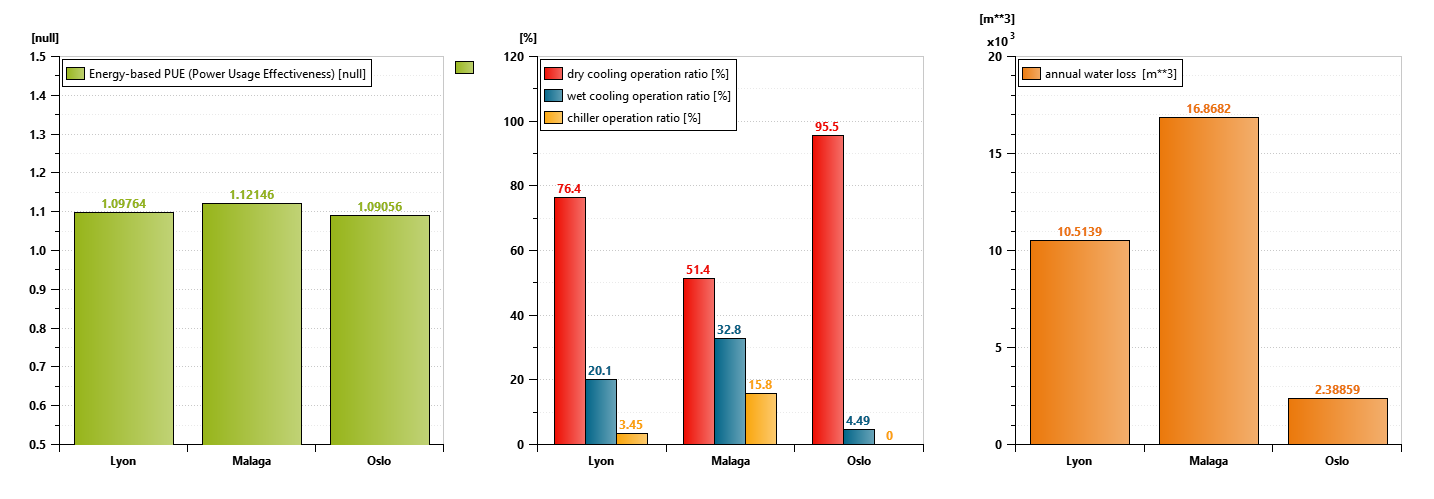
As can be seen on the above figure, the PUE is slightly higher in Malaga, which is explained by a higher usage of the chiller due to higher ambient temperatures. Wet cooling operation is also significantly higher for the same reason, thus explaining a higher water loss.
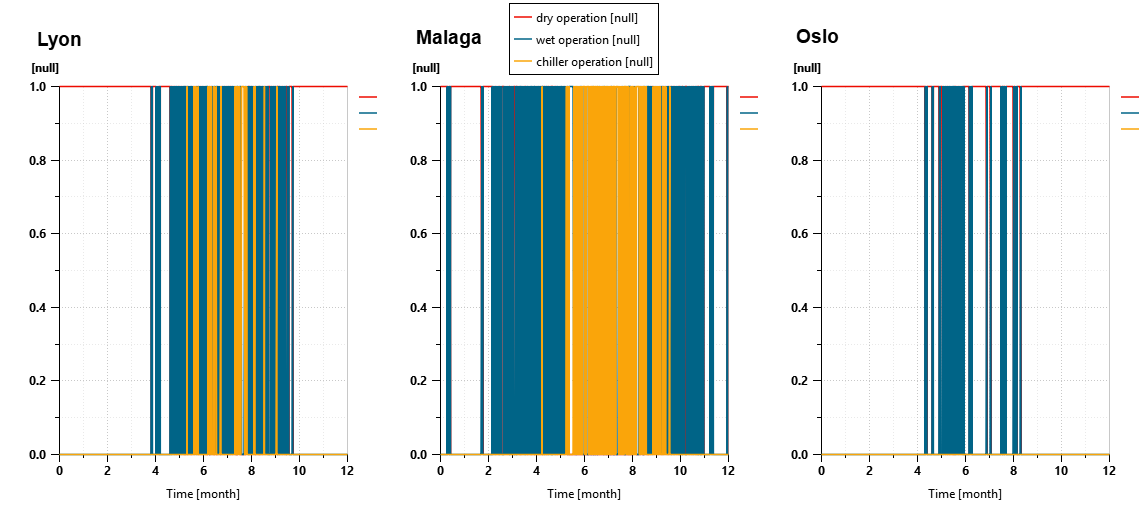
Note that in Oslo, the chiller is not needed since not used during the year.
As for all the observed variables, the cooling operation type can be extracted as instantaneous value throughout the year
- Energy distribution
Let’s have a look now at the energy distribution for all the scenarios. The figure below gathers all of them as a global overview.
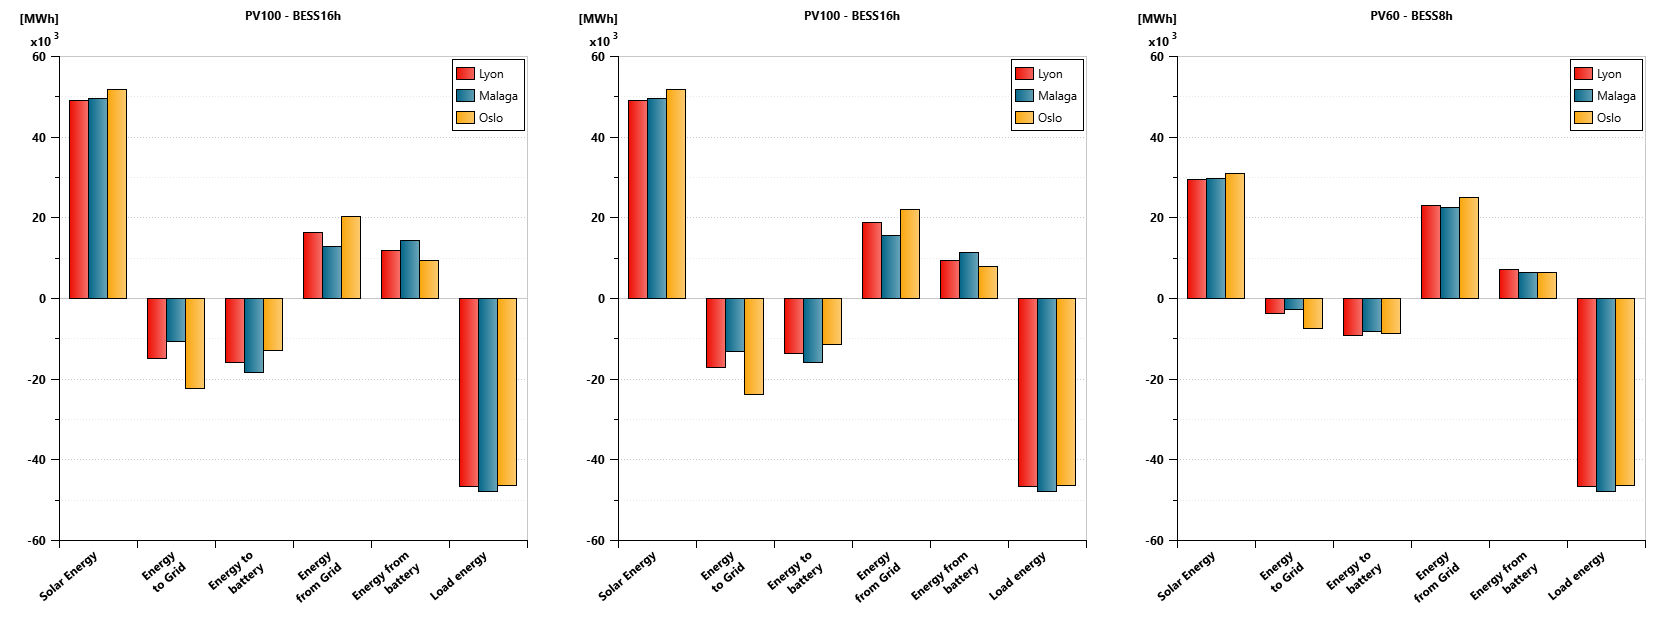
Here is a quick analysis:
- The Solar production for PV100 scenario is higher than the load
- The energy shifting sizing scenario is however not achieved since energy is imported and exported to and from the grid, which shows the difficulty in sizing BESS together with Renewables due to the intermittent nature of the production
- The PV60 BESS8h seems to be more balanced in terms of energy flows
Let’s now have a closer look at 2 important variables when talking about Solar Panels production and usage:
- self-consumption, which is the part of the solar production that is used on-site
- self-sufficiency, which is the part of the energy consumed covered by solar production
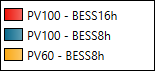
Note that the graphs presented hereafter (unless otherwise specified) use the following color-code for the 3 sizing scenarios:
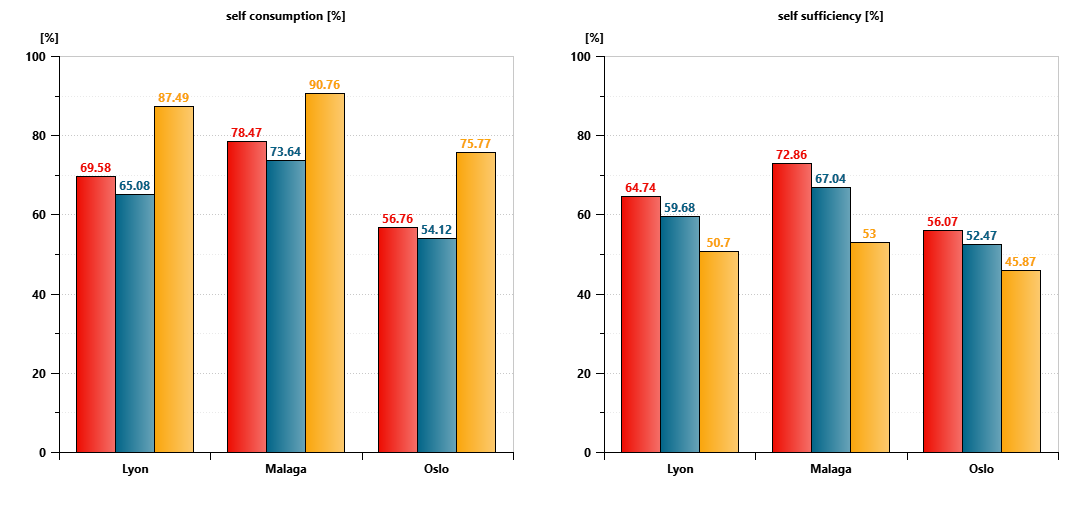
As mentioned previously, we clearly see here that the 3rd scenario, i.e. PV60 BESS8h is the best one since we are reaching close to 90% of self-consumption for Malaga.
The self-sufficiency is however quite low since reaching a maximum of 53% for Malaga, while being maximum and close to 73% for PV100 BESS16h for Malaga.
Note that a low self-sufficiency level is not necessarily a downside since it can reflect a grid import/export strategy linked to the electricity price fluctuations.
We will later see how it translates in costs and break even, but let’s go back to a more popular way to look at energy flows with Sankey diagrams representation.
- Energy flows
Sankey diagrams are very useful to have an overview of energy flows within a system. Let’s have a look at 2 scenarios: Malaga PV100 BESS16h and Oslo PV60 BESS8h
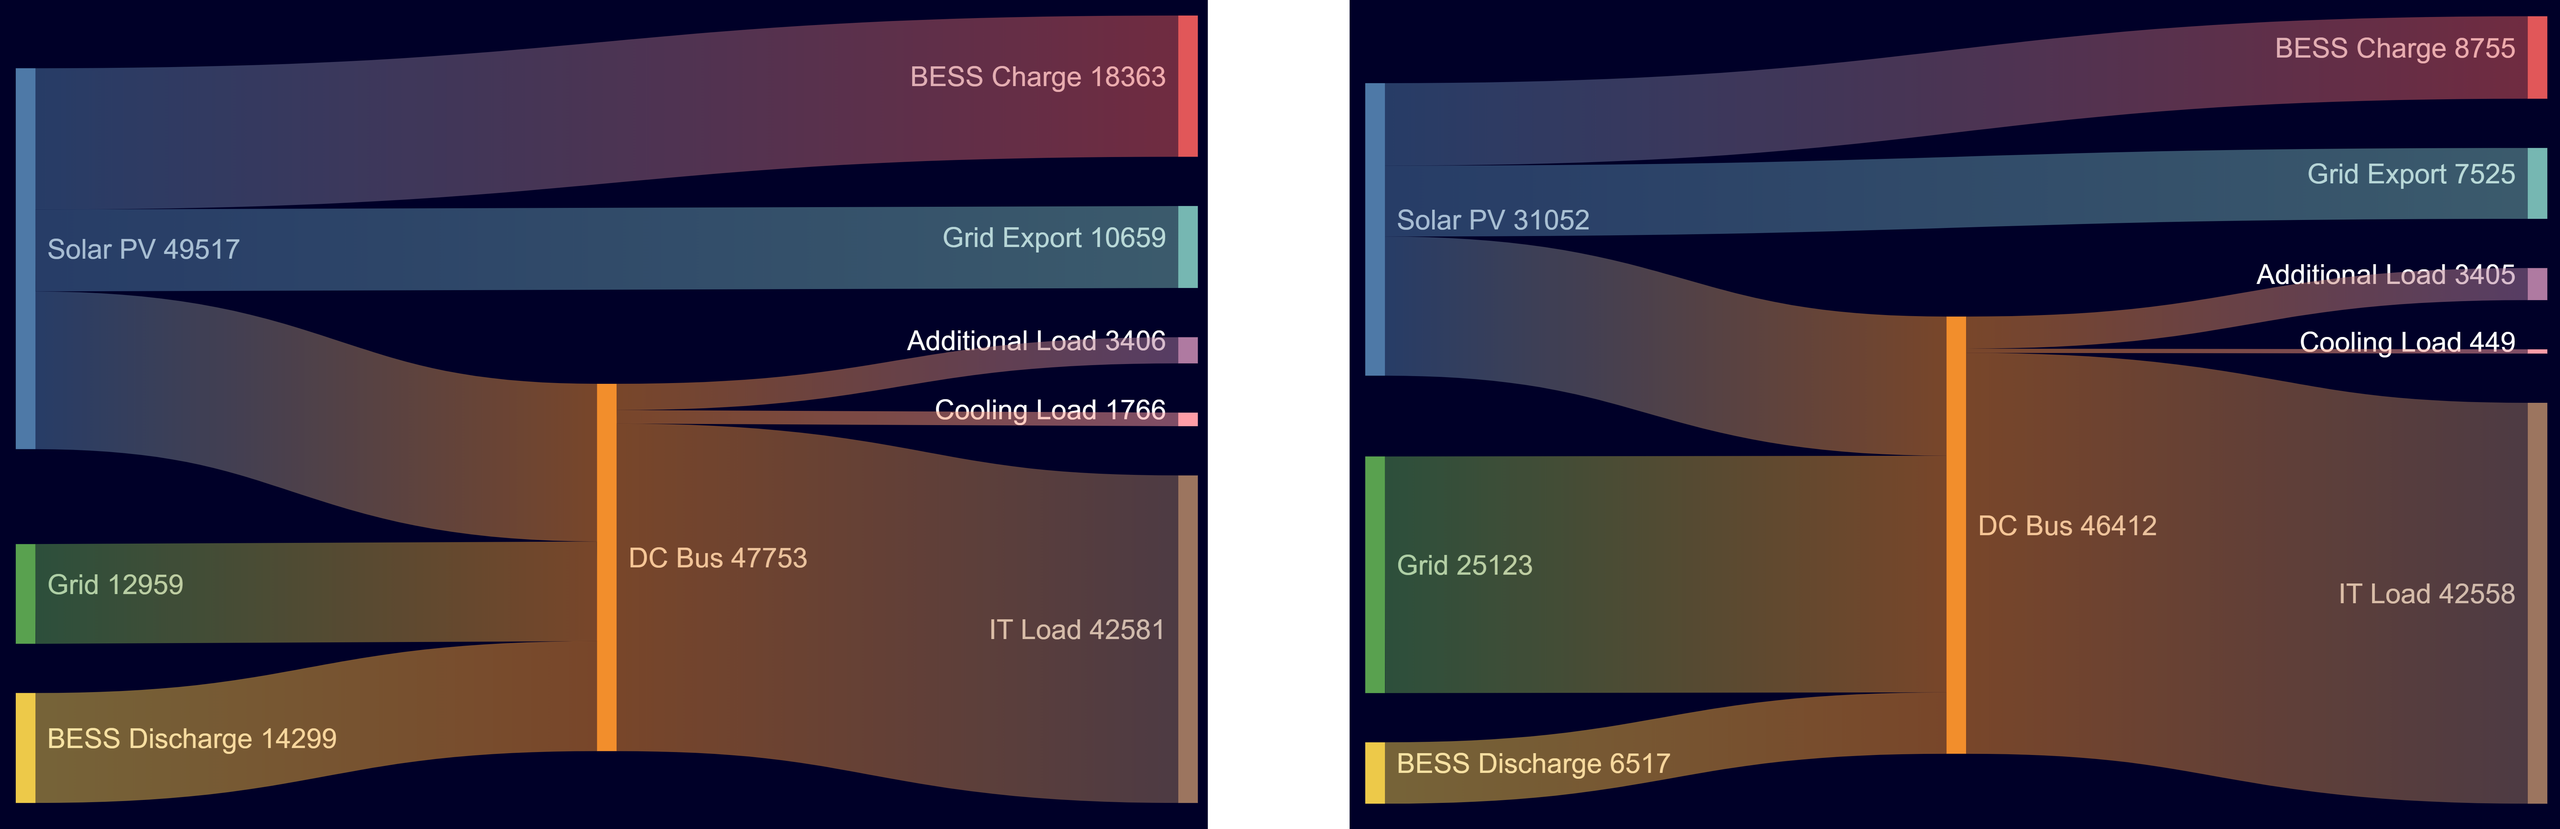
We clearly see with this representation that the main source of energy is Solar for the first case, the Grid for the second one.
- Economical outputs
Let’s now have a look at the economic aspects of this analysis.
We can first look at the first year of operation cost:
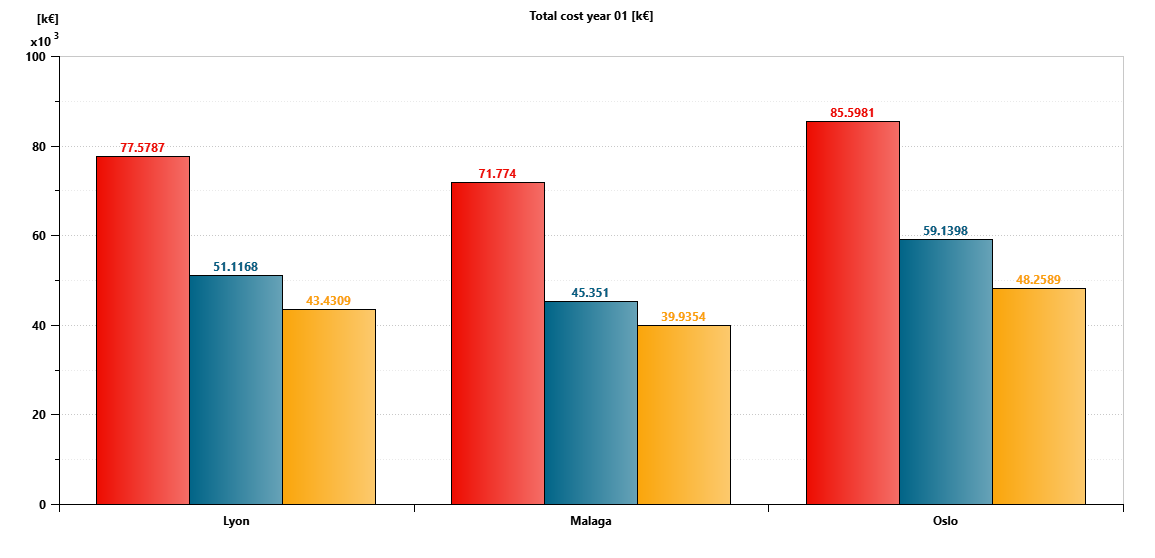
The first year is of course largely dominated by the CAPEX (see figure below)
Taking for example Oslo and PV100 BESS8h scenario, the CAPEX is about 84.927M€ while the OPEX represents only 0.671M€, thus representing 99.2% of the total first year costs.
What can we expect as break even period ? Let’s calculate the cost of 15 years of operations and compare it to the cost of not investing in Solar panels and BESS (considering a 3% increase of grid electricity price)
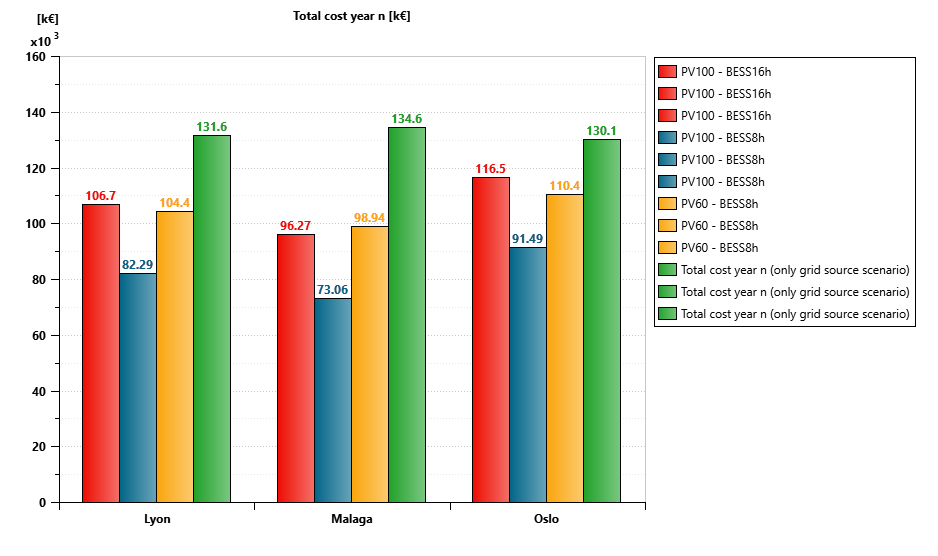
We clearly see here that for all cases, a solution without any PV or BESS costs at least 30% higher than a solution including PV and BESS.
The lower cost is associated with the PV100 and BESS8h scenario with a cost difference (compared to the “grid only” scenario) of -37%, -46% and -30% respectively for Lyon, Malaga and Oslo
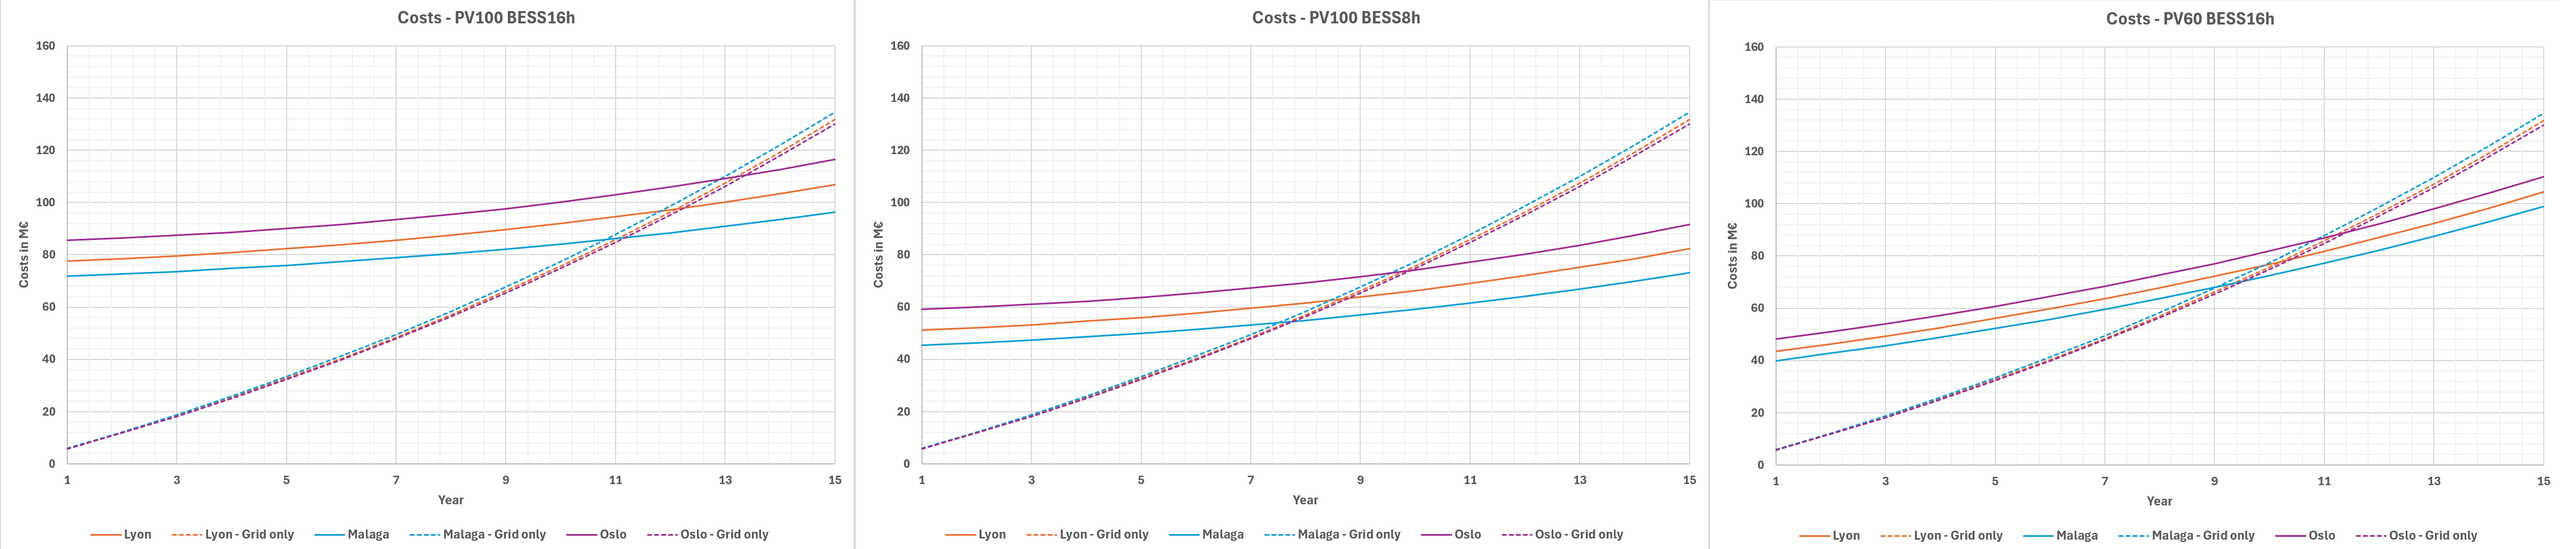
Figure 16 represents the cost evolution over 15 years and enables us to determine the break-even period for each scenario. The table below gathers this information for all scenarios
| City | PV100 BESS16h | PV100 BESS8h | PV60 BESS8h |
| Lyon | 12 | 8.6 | 10.2 |
| Malaga | 11 | 7.4 | 9 |
| Oslo | 13.4 | 9.8 | 11.4 |
As confirmed by the energy analysis the lowest modeled cost among the scenarios evaluated seems to be the PV100 BESS8h.
The BESS prices being still very high, this explains that the first solution requires a long break-even period.
This study shows the interest in having a source of renewable power, that could be different depending on the location (for instance, wind turbines might be a better solution for Oslo).
This study has been limited to 9 scenarios but optimal sizing could be found through optimization, advanced economical assessments such as strategies depending on the fluctuating electricity prices can also be addressed by this simulation framework.
Conclusion
The combination of thermal, hydraulic, electrical, control, and economic models within a unified simulation environment enables a holistic evaluation of next-generation AI data center architectures.
By coupling weather-dependent cooling performance with renewable generation and battery storage operation over an entire year, engineers can quantify the interactions between infrastructure sizing, operational efficiency, and economic viability before committing to physical deployment.
Such model-based engineering approaches provide a robust framework for the design and optimization of high-density liquid-cooled data centers, where cooling, power distribution, and energy management must increasingly be treated as a tightly integrated system rather than independent subsystems.
Frequently asked questions
What is AI data center liquid cooling simulation?
AI data center liquid cooling simulation uses virtual models to evaluate interactions between IT loads, liquid-cooling systems and supporting energy infrastructure. In this study, Simcenter Amesim combines thermal-fluid, electrical, control and economic models to evaluate a 5.22 MW liquid-cooled AI data center pod.
How does climate affect liquid-cooled data center performance?
Climate affects the operation of chillers, economizers and wet or dry cooling. In this simulation, the three modeled locations showed different cooling behavior, PUE and water consumption, illustrating why local weather conditions matter when evaluating cooling-system performance.
How do solar PV and battery storage support an AI data center?
In the modeled strategy, solar generation supplies the data center load first. Excess energy charges the battery and can then be exported to the grid, while stored energy can supply the load when solar power is unavailable.
Can solar generation make an AI data center self-sufficient?
Producing sufficient solar energy over a year does not necessarily mean that energy is available when it is needed. The simulations show why generation, demand and storage need to be evaluated together over time.
Does adding more battery storage always improve the economics?
Not in the scenarios evaluated here. Additional storage can change how solar energy is used, but it also increases investment costs. The study therefore compares different PV and battery configurations to understand the trade-off between energy performance and modeled long-term costs.
Why simulate data center cooling and electrical systems together?
Cooling demand, IT loads, weather, solar generation, battery operation and grid exchanges interact. Modeling them as one system helps engineers evaluate how decisions in one part of the data center influence energy flows, PUE and modeled costs elsewhere.
References
[1] Dual sun DS500-120M10TB-03 technical data
https://dualsun.com/en/professionals/datasheet/flash-500-half-cut-glass-glass-topcon/#techdata
[2] PVGIS (Photovoltaic Geographical Information System)
https://re.jrc.ec.europa.eu/pvg_tools/en/
[3] Historical Weather data from Open-Meteo
https://open-meteo.com/en/docs/historical-weather-api
[4] Industrial Battery Energy Storage Costs & ROI in Europe – A Guide for Commercial & Industrial Users
[5] Solar CAPEX Europe 2025-2026 — PV Investment Costs by Country & Segment
https://www.solardataatlas.com/en/data-solar-capex-europe
[6] Grille tarifaire du Tarif Vert d’EDF en Longue Utilisation (LU) – August 2026
https://entreprises.selectra.info/energie/profils/tarif-vert
[7] Uptime intelligence survey 2026
https://intelligence.uptimeinstitute.com/resource/growing-pue-advantage-larger-data-centers
[8] What Is a PUE Data Center? A Complete Guide to Power Usage Effectiveness
https://digitalpower.huawei.com/en/blogs/pue-data-center
Want to try Simcenter Amesim yourself?