Debugging My UVM Factory and UVM Config
UVM and Better Debug – The UVM Factory and Config conspire against me
Sitting in my chair pulling out what’s left of my hair, trying to find my bug. Well, my customers’ bug, but now my bug too.
The customer has written a simple “replacement” monitor in UVM. This new monitor adds coverage. With a simple factory override the new monitor SHOULD be in place, collecting coverage, but it is not. The UVM testbench compiles and runs just fine. But no coverage is collected. No error message. A UVM Mystery. Causing UVM Misery…
I check what the internal name of the classes are. No help. Things look fine.
Visualizer 25> classinfo descriptive tb_pkg::monitor::monitor__1
# Class /tb_pkg::monitor::monitor__1 maps to monitor #( 8)
Visualizer 26> classinfo descriptive tb_pkg::monitor_with_cvg::monitor_with_cvg__1
# Class /tb_pkg::monitor_with_cvg::monitor_with_cvg__1 maps to monitor_with_cvg #( 8)
So I jump into interactive simulation. I’ll set some breakpoints INSIDE the UVM factory – just where I want to be on a Friday.
Trapped. Sitting in the debugger. Setting breakpoints. But a tricky outcome.
It turns out that there are two problems. The first problem is that parameterized classes are not first class citizens in the UVM Factory. Both of my monitors have the same name in the factory – “<unknown>”. You can see this if you do factory.print(). The second problem is that the rules of type compatible assignments are complicated, and this user had written some code that made it hard to see.
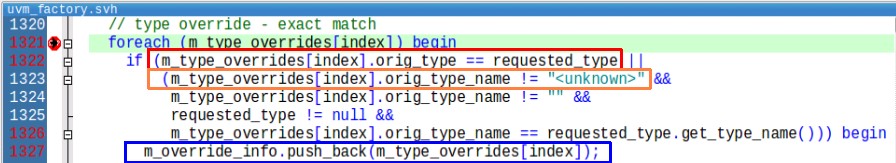
The RED box is going to fail. The type requested is NOT the same as the orig_type. The ORANGE box is true. The orig_type_name IS “<unknown>”. So the BLUE box will NOT be executed. (The BLUE box is a successful lookup for the factory override. We want the BLUE box!). We just failed to find the override. Failure means NO override, just use the original type! Aha! We missed the override and just used the non-code-coverage enabled monitor. But why didn’t it match?
It should have matched on the RED box! The type should have been the same. How could it be different?
In the test, we set the override, to replace the regular monitor with the coverage enabled monitor:
monitor#(BITWIDTH)::type_id::set_type_override(monitor_with_cvg#(BITWIDTH)::get_type());
In the agent, I have:
monitor#(BITWIDTH) m;
function void build_phase(uvm_phase phase);
  m = monitor#(BITWIDTH)::type_id::create("m", this);
endfunction
From the debugger, let’s try dumping the database with this tcl script:
# puts "full_inst_path [examine {m_type_overrides[0].full_inst_path}]"
# puts "orig_type_name [examine {m_type_overrides[0].orig_type_name}]"
# puts "ovrd_type_name [examine {m_type_overrides[0].ovrd_type_name}]"
# puts "      selected [examine {m_type_overrides[0].selected}]"
# puts "     orig_type [examine {m_type_overrides[0].orig_type}]"
# puts "     ovrd_type [examine {m_type_overrides[0].ovrd_type}]"
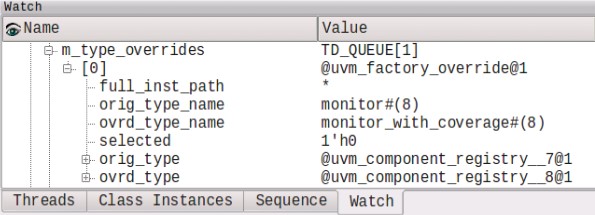
Huh? Lots of <unknown> AND we see that indeed, the orig_type is not the same as the requested_type. According to the factory THIS override is not applicable for the requested_type. But we know it is.
# full_inst_path *
# orig_type_name <unknown>
# ovrd_type_name <unknown>
#       selected 1'h0
#      orig_type {{<unknown>} @uvm_component_registry__8@1}
#      ovrd_type {{<unknown>} @uvm_component_registry__6@1}
# requested_type {{<unknown>} @uvm_component_registry__7@1}
Hmm. Something heretical! Let’s replace those nasty uvm_component_param_utils macros with a few lines of SystemVerilog. Looks what happens when we DON’T use the UVM macros… No more “<unknown>”. We still didn’t fix our problem, but now debug is getting better. And we get a nice SystemVerilog assignment error message.
# full_inst_path *
# orig_type_name monitor#(8)
# ovrd_type_name monitor_with_coverage#(8)
#       selected 1'h0
#      orig_type {{monitor#(8)} @uvm_component_registry__7@1}
#      ovrd_type {{monitor_with_coverage#(8)} @uvm_component_registry__8@1}

# requested_type {{monitor#(8)} @uvm_component_registry__6@1}
Or just use the GUI, instead of the command language
That’s getting to be a useful debug…
What happened in this case is that the factory failed to be applied and ADDITIONALLY the UVM produced no error message. The code ran fine. This is a big problem – how can you tell what is running if your factory overrides don’t take?
See our paper in DVCON India – “Paper 6.1 Does the Factory Say Override?” for all the gory details. Spoiler alert! The user code fix is simple. Change “class monitor#(UINT32 BITWIDTH) …” to “class monitor#(BITWIDTH) …”. But boy was that hard to find.
Better debug here means fixing the UVM factory bugs and adding instrumentation for transparency. The paper has details on ways to improve debug.
Speaking of trouble in debug land. Have you ever had your config setting get it wrong?
Oops. I put the config setting on the wrong hierarchy.
Oops. I set the config AFTER I did the get.
Oops. I did a config get in a very expensive loop (a clock loop).
Stop by DVCON Europe – “Paper 5.2 Go Figure – UVM Config – The Good, The Bad, The Debug” to hear about a simple suggestion to add UVM configuration debug. But I’ll give you a preview.
The config database is a data structure. We put things in it (we “set” configurations). We get things out of it (we “get” configurations). For example, we might set the configuration for an AXI bus, including the desired traffic density. Later, in our testbench, we might get the configuration, and build the testbench to generate this traffic density. What if we get the wrong traffic density? How will we know? How to debug it?
For this setting and getting, how about adding three arguments (in BOLD italics below)
static function bit get(uvm_component cntxt,
  string inst_name,
  string field_name,
  inout T value,
  input uvm_object CALLING_CONTEXT = null,
  input string FILE = "",
  input int    LINE = 0
);
And
static function bit get(uvm_component cntxt,
  string inst_name,
  string field_name,
  inout T value,
  input uvm_object CALLING_CONTEXT = null,
  input string FILE = "",
  input int    LINE = 0
);
With these additions every time we do a set, we remember where this set came from. We remember the file and line number, and the calling context (the object handle) where the set executed. Every time we do a get, we can report the file and line number and the calling context (the object handle) where the get executed. Now we have really good visibility to the flow of sets and gets. The UVM does provide some debug switches, but they shed no light when you are trying to debug what happened in this hairball if-then-else. And this is just one small piece of configuration. In addition to adding the RED lines above, the decision making code inside the UVM config needs to be instrumented, so that we can understand which decision point caused a match to succeed or fail. The code below needs to be expanded (instrumented) to improve transparency for debug. (Hint: See the paper at DVCON Europe).
function uvm_resource_types::rsrc_q_t lookup_name(string scope = "",
  string name,
  uvm_resource_base type_handle = null,
  bit rpterr = 1);
  uvm_resource_types::rsrc_q_t rq;
  uvm_resource_types::rsrc_q_t q = new();
  uvm_resource_base rsrc;
  uvm_resource_base r;

  // resources with empty names are anonymous and do not exist in the name map
  if(name == "")
    return q;

  // Does an entry in the name map exist with the specified name?
  // If not, then we're done
  if((rpterr && !spell_check(name)) || (!rpterr && !rtab.exists(name))) begin
    return q;
  end
  rsrc = null;
  rq = rtab[name];
  for(int i=0; i<rq.size(); ++i) begin
    r = rq.get(i);
    // does the type and scope match?
    if(((type_handle == null) || (r.get_type_handle() == type_handle)) &&
      r.match_scope(scope))
        q.push_back(r);
  end
  return q;
endfunction
I hope you enjoyed this slog through debug. But luckily for all of us UVM Factory debug and UVM Config debug are USUALLY something we do infrequently, usually at testbench bring up time. When factory or config fail, usually something will be dreadfully wrong with our simulation – like running 10 times longer than expected, generating more or less traffic than expected, or failing to collect coverage. Usually, since the failure is so obvious we know something is wrong and fix it, never needing to debug the factory or config again. (Until someone changes the factory or config).
Meanwhile, if you have some time to kill, and you are interested in factory debug and assignment compatibility, you can play around with this code:
class M#(BITWIDTH=16);
  function new();
    $display("%s::new()", $typename(this));
  endfunction
endclass

module top();
  parameter int           INT8 = 8;
  parameter int unsigned UINT8 = 8;

  M #(INT8)  msigned8;
  M #(UINT8) munsigned8;

  initial begin
    msigned8 = new();
    munsigned8 = new();
    munsigned8 = msigned8;
    $display("%s", $typename(msigned8));
    $display("%s", $typename(munsigned8));
  end
endmodule
Time to think about lunch. With a good debugger and some knowledge of the UVM you can be successful getting your factory override debugged and your configuration database debugged. But you might just lose some hair.


Comments
Leave a Reply
You must be logged in to post a comment.
Is there a way to know whether the type parameter is signed / unsigned ? .
LRM 20.6.1 :: $typename() says “The default signing is removed, even if present explicitly in the source” .
Some simulators still return a string which shows sign as well . Was looking Simulator independent solution .