Part 8: The 2016 Wilson Research Group Functional Verification Study
ASIC/IC Resource Trends
This blog is a continuation of a series of blogs related to the 2016 Wilson Research Group Functional Verification Study (click here). In my previous blog (click here), I focused on FPGA design and verification trends. I now will shift the focus of this series of blogs from FPGA trends to ASIC/IC trends. In this blog, I plan to discuss the growing ASIC/IC design project resource trends due to rising design complexity.
Figure 1 shows the percentage of total project time spent in verification. As you would expect, the results are all over the spectrum; whereas, some projects spend less time in verification, other projects spend more. The average total project time spent in verification in 2016 was 55 percent, which did not change significantly from 2012 and 2014. The data suggest that although Moore’s Law continues in terms of growing design complexity the industry isn’t getting any worse in terms of project time spent in verification.
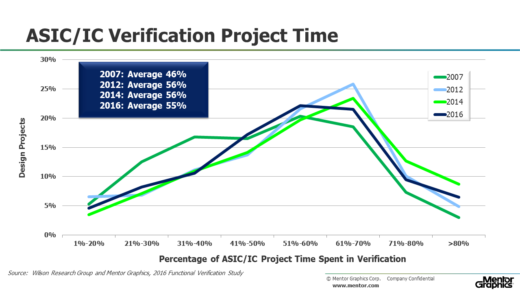
Figure 1. Percentage of ASIC/IC Project Time Spent in Verification
Perhaps one of the biggest challenges in design and verification today is identifying solutions to increase productivity and control engineering headcount. To illustrate the need for productivity improvement, we discuss the trend in terms of increasing engineering headcount. Figure 2 shows the mean peak number of engineers working on a project. Again, this is an industry average since some projects have many engineers while other projects have few. You can see that the mean peak number of verification engineers today is greater than the mean peak number of design engineers. In other words, there are, on average, more verification engineers working on a project than design engineers. This situation has changed significantly since 2007.
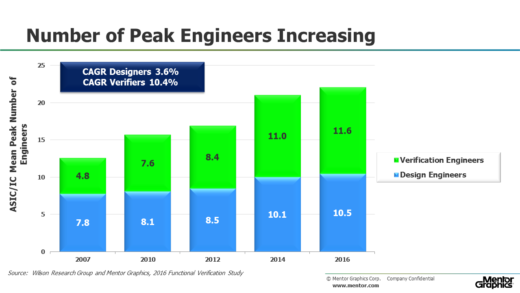
Figure 2. Mean Number of Peak Engineers per ASIC/IC Project
Another way to comprehend the impact of today’s project headcount trends is to calculate the compounded annual growth rate (CAGR) for both design and verification engineers. Between 2007 and 2016 the industry experienced a 3.6 percent CAGR for design engineers and a 10.4 percent CAGR for verification engineers, as shown in Figure 3. Although the data suggest that the demand for verification engineers is starting to slow down in 2016, clearly, the double-digit increase in required verification engineers has become a major project cost management concern, and is one indicator of growing verification effort.
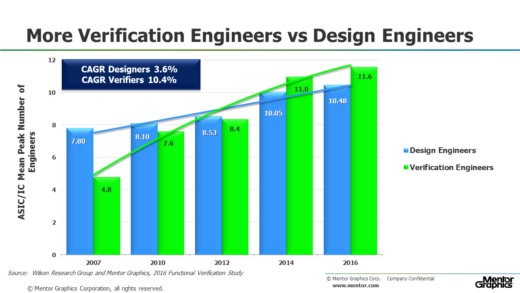
Figure 3. Peak Engineers CAGR per ASIC/IC Project
But verification engineers are not the only project stakeholders involved in the verification process. Design engineers spend a significant amount of their time in verification too, as shown in Figure 4. In 2014 and 2016, design engineers spent on average 53 percent of their time involved in design activities and 47 percent of their time in verification.
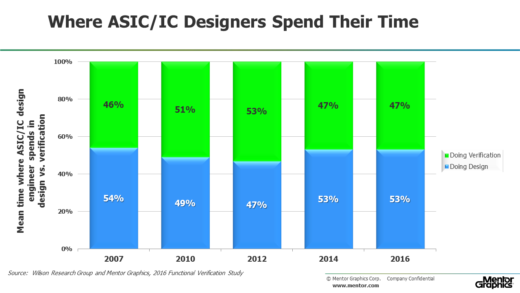
Figure 4. Where ASIC/IC Design Engineers Spend Their Time
However, this is a reversal in the trends observed from the 2010 and 2012 studies, which indicated that design engineers spent more time in verification activities than design activities. The data suggest that design effort has risen significantly in the last four years when you take into account that: (a) design engineers are spending more time in design, and (b) there was a nine percent CAGR in required design engineers between 2012 and 2014 (shown in Figure 2), which is a steeper increase than the overall 3.7 CAGR for design engineers spanning 2007 through 2016. We will discuss a few factors that might be contributing to this increased design effort in upcoming blogs.
Figure 5 shows where verification engineers spend their time (on average). We do not show trends here since this aspect of project resources was not studied prior to 2012, and there were no significant changes in the results between 2012, 2014, and 2016. Our study found that verification engineers spend more of their time in debugging than any other activity. This needs to be an important research area whose future solutions will be necessary for improving productivity and predictability within a project.
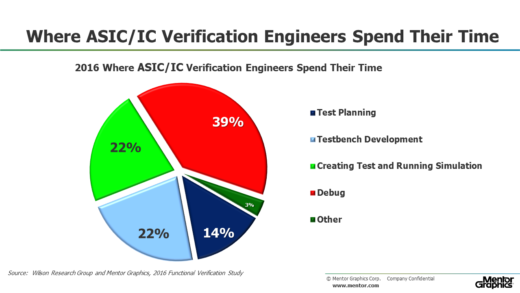
Figure 5. Where ASIC/IC Verification Engineers Spend Their Time
In my next blog (click here) I plan to discuss various ASIC/IC verification solutions adoption trends.
Quick links to the 2016 Wilson Research Group Study results
- Prologue: The 2016 Wilson Research Group Functional Verification Study
- Understanding and Minimizing Study Bias (2016 Study)
- Part 1 – FPGA Design Trends
- Part 2 – FPGA Verification Effort Trends
- Part 3 – FPGA Verification Effort Trends (Continued)
- Part 4 – FPGA Verification Effectiveness Trends
- Part 5 – FPGA Verification Technology Adoption Trends
- Part 6 – FPGA Verification Language and Library Adoption Trends
- Part 7 – ASIC/IC Design Trends
- Part 8 – ASIC/IC Resource Trends
- Part 9 – ASIC/IC Verification Technology Adoption Trends
- Part 10 – ASIC/IC Language and Library Adoption Trends
- Part 11 – ASIC/IC Power Management Trends
- Part 12 – ASIC/IC Verification Results Trends
- Conclusion: The 2016 Wilson Research Group Functional Verification Study
Comments