Part 1: The 2016 Wilson Research Group Functional Verification Study
FPGA Design Trends
In my previous blog, I introduced the 2016 Wilson Research Group Functional Verification Study (click here). The objective of my previous blog was to provide an overview on our large, worldwide industry study. The key findings from this study will be presented in a set of upcoming blogs. In this blog, I present trends related to various aspects of FPGA design to illustrate growing design complexity.
Let’s begin by examining embedded processor trends targeted at a general FPGA implementation. Our 2016 study found that 59% of all FPGA designs contained one or more embedded processors, as shown in Figure 1. This is a slight increase over our 2014 study. Most of this growth is in the number of FPGA projects creating designs containing more than one embedded processor.
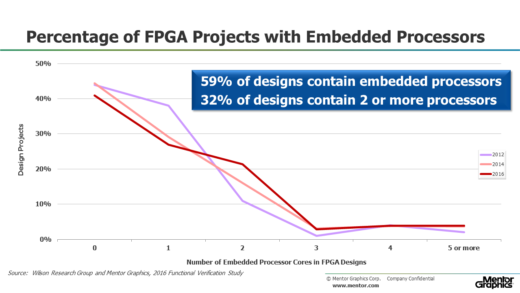
Figure 1. Number of embedded processors in FPGA designs
SoC class designs (i.e., designs containing embedded processors) add a new layer of verification complexity to the verification process that did not exist with traditional non-SoC class designs due to hardware and software interactions, new coherency architectures, and the emergence of complex network-on-a-chip interconnect.
In addition to embedded processors targeted at general FPGA class of designs, there has been a recent emergence of specific programmable SoC FPGA implementations, such as: Xilinx’s Zynq, Altera’s Arria/Cydone, and Microsemi’s SmartFusion. Figure 2 shows the adoption trends for these programmable SoC FPGAs, which you can see has grown at about a 27% CAGR since 2012. Keep in mind that this trend data does not represent silicon volume production—it represents the number of FPGA projects that are creating designs targeted at a programmable SoC class of FPGA.
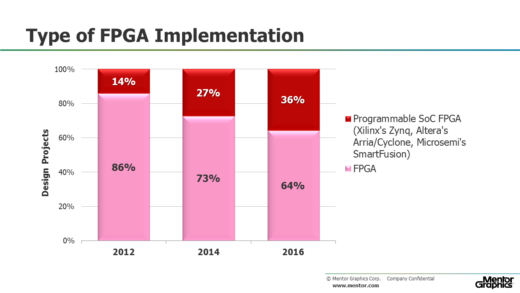
Figure 2. Type of FPGA implementation trends
As the industry moves to SoC class designs, regardless of type of FPGA implementation, FPGA projects are starting to increase their adoption of industry standard on-chip bus protocols—versus proprietary bus protocols. Figure 3 shows the current adoption of ARM® AMBA® and other on-chip bus protocols for FPGA designs as identified by our new study. For 2016, we saw a statistically significant increase in AMBA AXI adoption for FPGA designs.
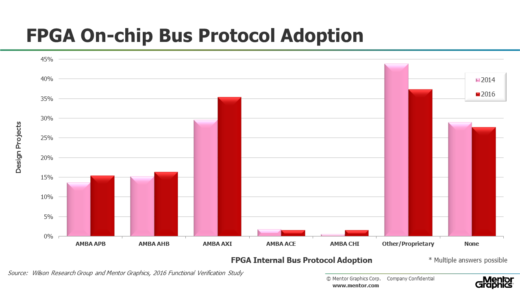
Figure 3. FPGA on-chip bus protocol adoption
Another aspect of SoC class design is the emergence of IP-based design practices, which is fundamental for improving design productivity. Figure 4 shows FPGA design composition trends—and we see that since 2012 there has been a declined in new logic created by FPGA project teams. At the same time we are starting to see an increase in the adoption of both internally developed and externally acquired IP.
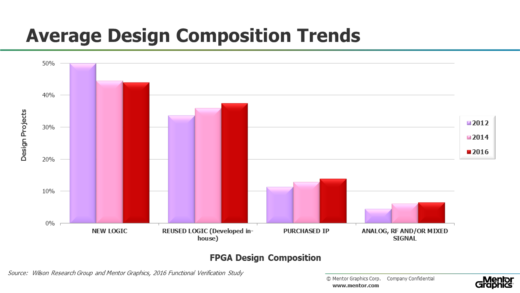
Figure 4. FPGA design composition trends
There were two new design areas we decided to explore for our 2016 survey that we have never studied in the past, and that is safety-critical designs and designs containing security features. I am generally hesitant to release the results from any new questions we ask in a study until we have asked the questions on at least one subsequent study. Part of the reason is, there is always a chance that the findings from the first time a question is asked could result in an anomaly in the response rate or that the question asked lends itself to misinterpretation and needs to be refined. It generally requires multiple studies and trends observations to flush these issues out. Nonetheless, I have decided to release the data on the percentage of FPGA projects that claim to work on safety-critical designs and the percentage of FPGA projects that claim to be implementing security features in their design since their is a lot of recent interest in these class of designs.
Figure 5 shows the percentage of FPGA projects who claim they are working on designs that follow either DO-254, ISO26262, IEC60601, IEC61508, or some other safety process development standard.
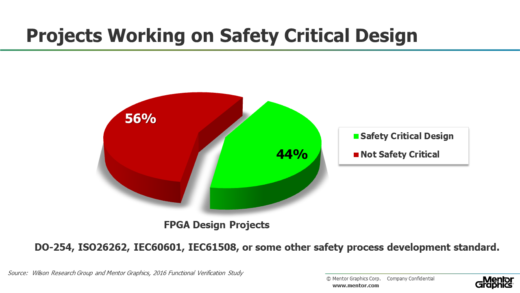
Figure 5. Percentage of FPGA design working on safety-critical designs
Figure 6 shows the percentage of FPGA projects who claim that they are implementing security features in their designs.
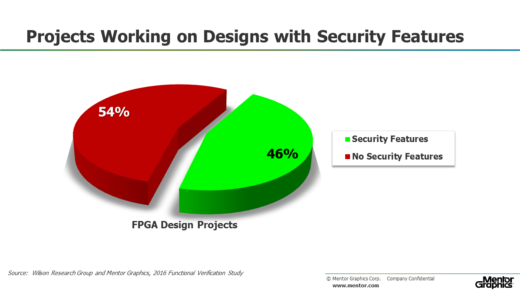
Figure 6. Percentage of FPGA design working on safety critical designs
In my next blog (click here), I’ll focus on verification effort trends related to FPGA designs.
Quick links to the 2016 Wilson Research Group Study results
- Prologue: The 2016 Wilson Research Group Functional Verification Study
- Understanding and Minimizing Study Bias (2016 Study)
- Part 1 – FPGA Design Trends
- Part 2 – FPGA Verification Effort Trends
- Part 3 – FPGA Verification Effort Trends (Continued)
- Part 4 – FPGA Verification Effectiveness Trends
- Part 5 – FPGA Verification Technology Adoption Trends
- Part 6 – FPGA Verification Language and Library Adoption Trends
- Part 7 – ASIC/IC Design Trends
- Part 8 – ASIC/IC Resource Trends
- Part 9 – ASIC/IC Verification Technology Adoption Trends
- Part 10 – ASIC/IC Language and Library Adoption Trends
- Part 11 – ASIC/IC Power Management Trends
- Part 12 – ASIC/IC Verification Results Trends
- Conclusion: The 2016 Wilson Research Group Functional Verification Study

Comments