Part 11: The 2012 Wilson Research Group Functional Verification Study
Verification Techniques & Technologies Adoption Trends (Continued)
This blog is a continuation of a series of blogs that present the highlights from the 2012 Wilson Research Group Functional Verification Study (for a background on the study, click here).
In my previous blog (Part 10 click here), I presented verification techniques and technologies adoption trends, as identified by the 2012 Wilson Research Group study. In this blog, I continue those discussions and focus on formal verification, acceleration/emulation, and FPGA prototyping.
For years, the term “formal verification” has bugged me since it is quite often misunderstood in the industry. The problem originated back in the mid 1990’s with the emergence of formal equivalence checking tools from various EDA vendors, such as Chrysalis Symbolic Design. These tools were introduced to the market as formal verification, which is technically a true statement. However, there are a range of tools available under the category formal verification, such as formal property checkers and equivalence checkers.
So, what’s the problem? The question related to formal property checking in prior studies could have been misinterpreted by some participants to mean equivalence checking, which reduces the confidence in the results. To prevent this misinterpretation, we decided to change the question in 2012 to clarify that we were talking about the formal verification of assertions and clearly state “not equivalence checking” in the question.
One other thing we wanted to learn in the formal verification space during this study was what percentage of the market was using these auto-formal analysis tools (such as X safety checks, deadlock detection, reset analysis, etc.) versus formal property checking tools. The previous studies never made this distinction.
The fact that we changed the question related to formal property checking while adding in auto-formal in the 2012 study means that there is no meaningful way to compare this study’s formal verification results to the formal verification results from prior studies.
Formal Technology Adoption Trends
Figure 1 shows the adoption percentages for formal property checking and auto-formal techniques.
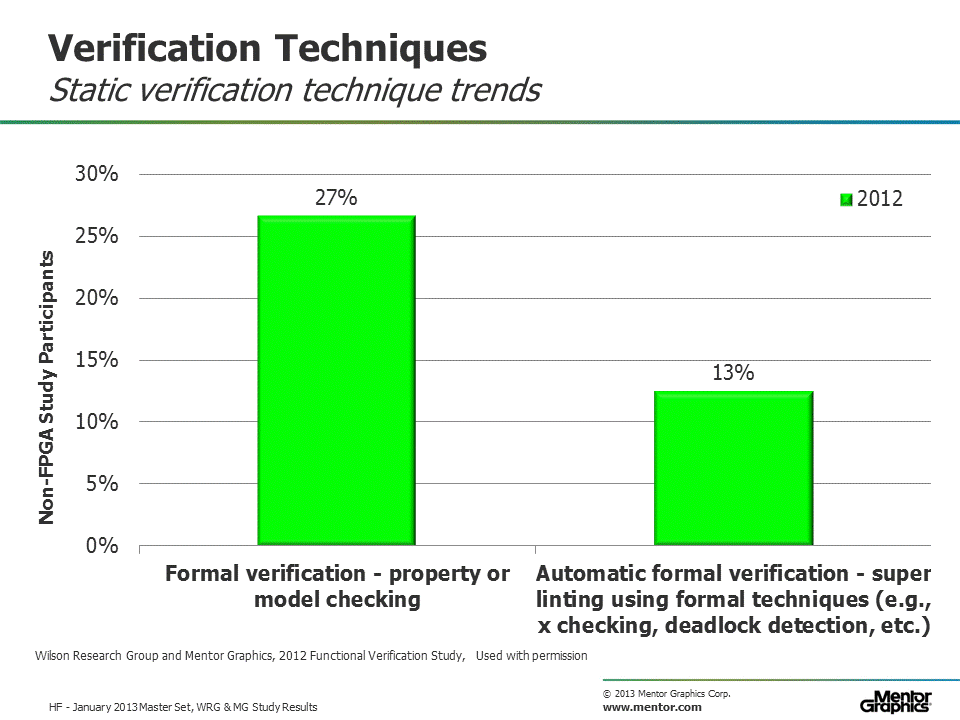
Figure 1. Formal Technology Adoption
We found that about five percent of the participants who are applying auto-formal techniques are not doing formal property checking. This means that the combined adoption of formal property checking and auto-formal techniques is about 32 percent. As a point of reference, the 2007 FarWest Research study found 19 percent adoption for formal verification—and the 2010 study found the adoption at 29 percent. Both the 2007 and 2010 studies included the potential erroneous responses associated with formal equivalence checking, as well as auto-formal usage.
Figure 2 provides a different analysis of the formal property adoption data by partitioning the results by design sizes. The design size partitions are represented as: less than 5M gates, 5M to 20M gates, and greater than 20M gates.
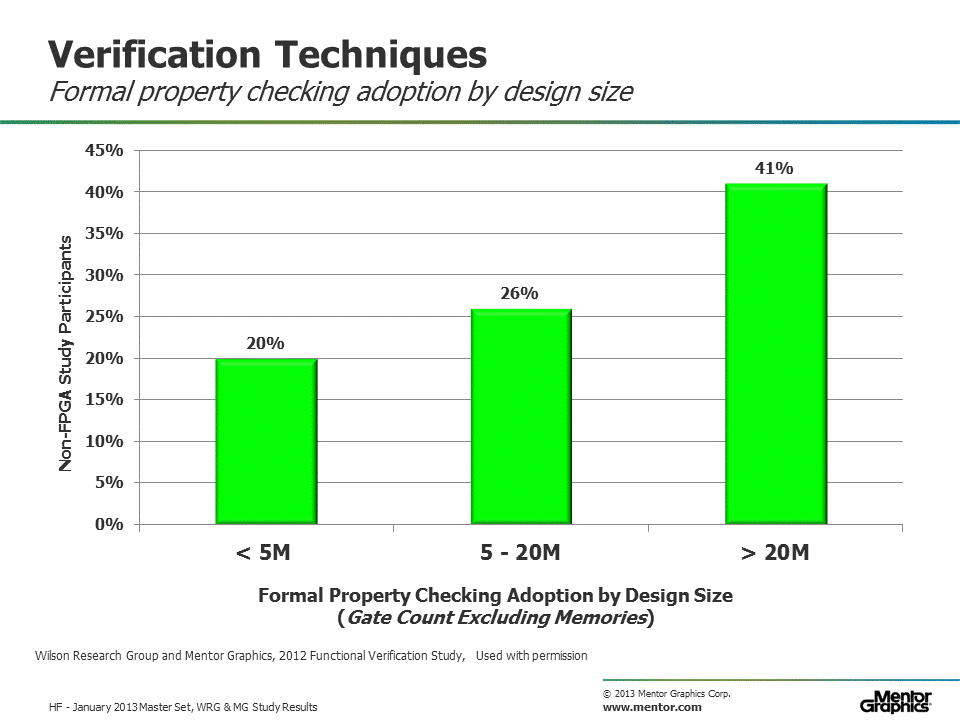 Figure 2. Formal property checking adoption by design size
Acceleration/Emulation & FPGA Prototyping Adoption Trends
The amount of time spent in a simulation regression is an increasing concern for many projects. Intuitively, we tend to think that the design size influences simulation performance. However, there are two equally important factors that must be considered: number of tests in the simulation regression suite and the length of each test in terms of clock cycles.
For example, a project might have a small or moderate-sized design, yet verification of this design requires a long running test (e.g., a video input stream). Hence, in this example, the simulation regression time is influenced by the number of clock cycles required for the test and not necessarily the design size itself.
Figure 3 shows the number of directed tests created to verify a design in simulation (i.e., the regression suite). The findings obviously varied dramatically from a handful of tests to thousands of tests in a regression suite, depending on the design.
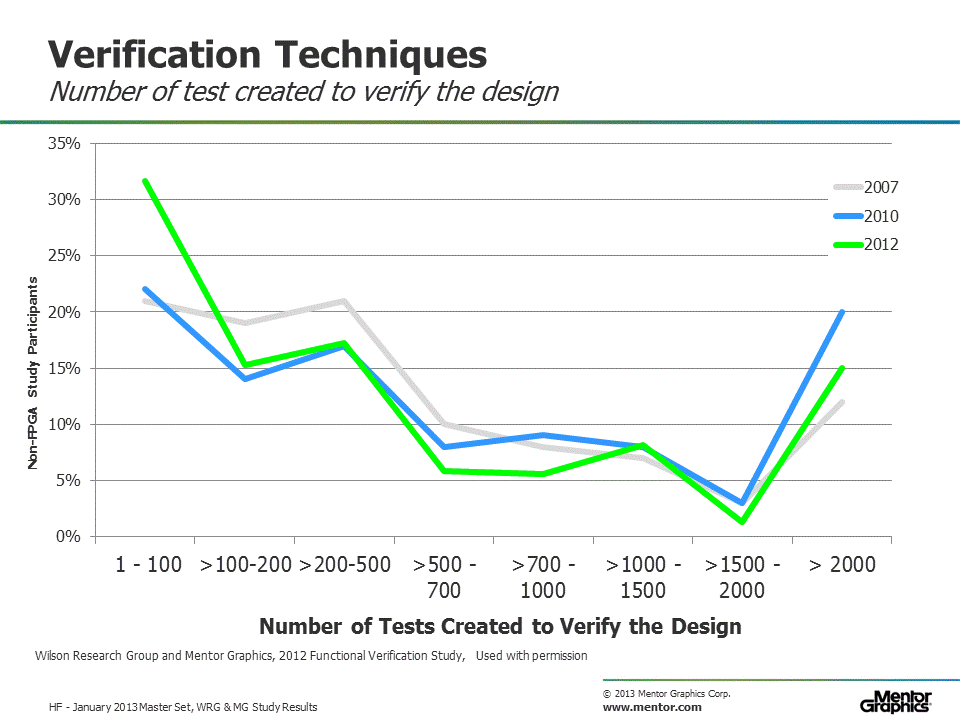 Figure 3. Number directed test created to verify a design
The increase in tests in the range of 1-100 is interesting to note. Is this due to the increase in adoption of constrained-random verification techniques in the past few years? Or possibly, something else is going on here. This line of questioning illustrates the value of reviewing various industry studies. That is, it is not so much in the absolute values a study presents, but the questions the new data raises.
Next, let’s look at regression times as shown in Figure 5. As you can see, it also varies dramatically from short regression times for some projects to multiple days for other projects. The median simulation regression time is about 16-24 hours. Here, we also see an increase in shorter regression times. Again this data raises some interesting questions that are worth exploring.
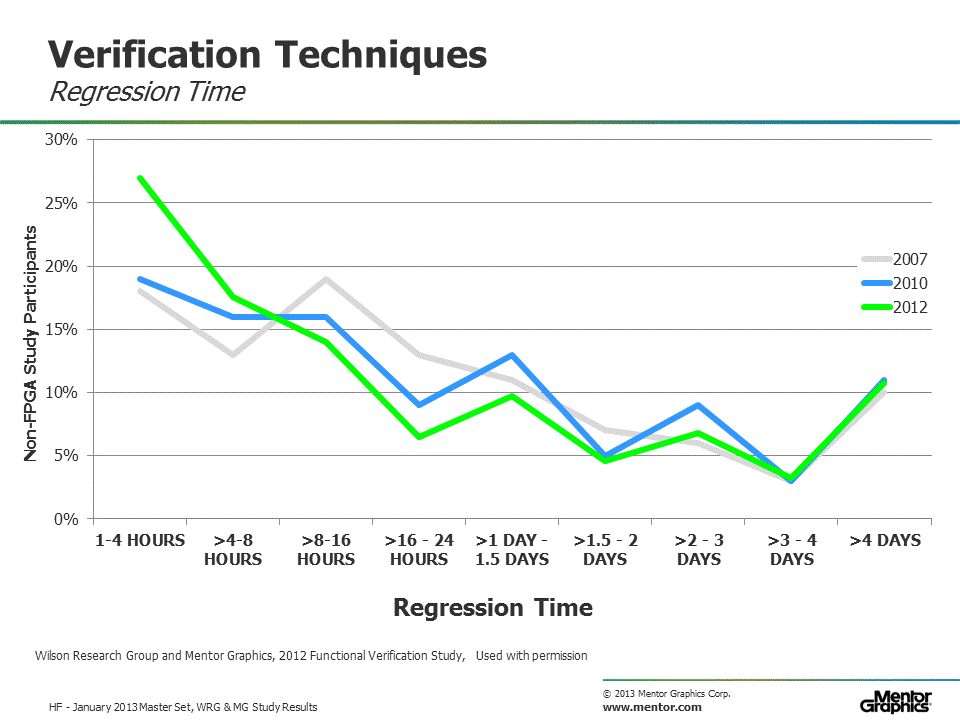 Figure 4. Simulation regression time trends
One technique that is often used to speed up simulation regressions (either due to very long tests and lots of tests) is either hardware-assisted acceleration or emulation. In addition, FPGA prototyping, while historically used as a platform for software development, has recently served a role in SoC integration validation.
Figure 5 shows the adoption trend for both HW-assisted acceleration/emulation and FPGA prototyping by comparing the 2007 Far West Research study (in gray), the 2010 Wilson Research Group study (in blue), and the 2012 Wilson Research Group study (in green). We see a continual rise in HW acceleration and emulation. This is not only due to the need to verify larger designs, or designs with long test times. HW acceleration and emulation has become the key platform for SoC Integration verification, where both hardware and software are integrated into a system for the first time. In addition, emulation is being used increasingly as a software development platform.
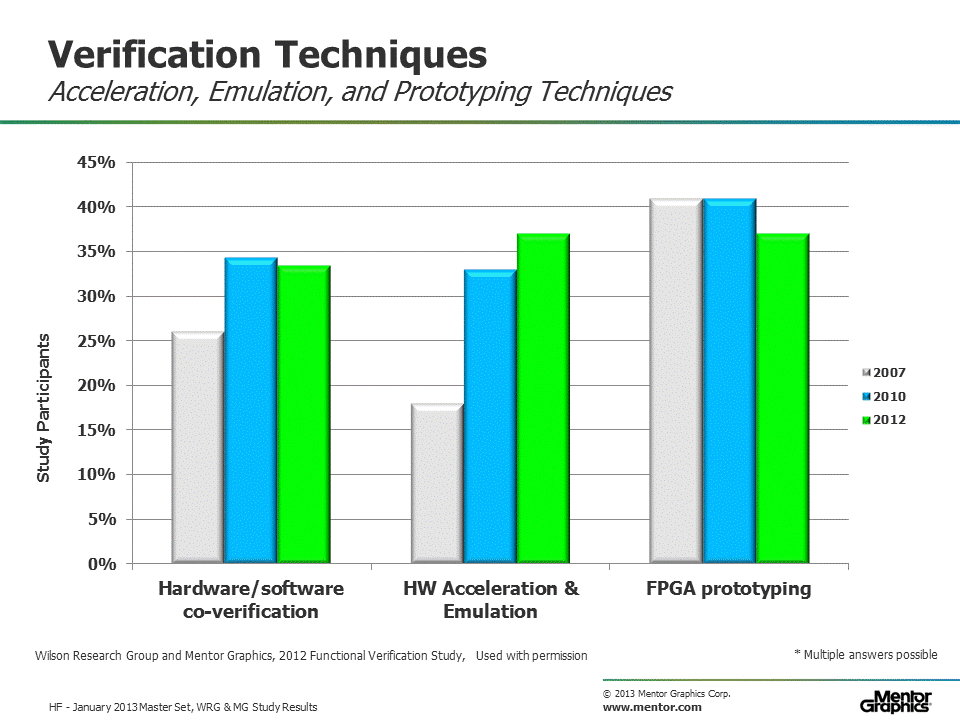
Figure 5. HW-assisted acceleration/emulation and FPGA Prototyping trends
Note that the adoption of FPGA prototyping has remained flat (or decreased slightly as the 2012 data suggest). This might seem counter-intuitive since we previously saw a trend in terms of the increase in SoC class designs. So what’s going on?
Figure 6 partitions the data for HW-assisted acceleration/emulation and FPGA prototyping adoption by design size: less than 1M gates, 1M to 20M gates, and greater than 20M gates. Notice that the adoption of HW-assisted acceleration/emulation continues to increase as design sizes increase. However, the adoption of FPGA prototyping rapidly drops off as design sizes increase beyond 20M gates.
 Figure 6. Acceleration/emulation and FPGA prototyping adoption by design size
This graph illustrates one of the problems with FPGA prototyping of very large designs, which is that there is an increased engineering effort required to partition designs across multiple FPGAs. In fact, what I have found is that FPGA prototyping of very large designs is often a major engineering effort in itself, and that many projects are seeking alternative solutions to address this problem.
In my next blog (click here), I will present the final data I plan to share from the Wilson Research Group study. This blog will focus on results in terms of meeting schedules, required spins, and classes of bugs contributing to respins. I will then wrap up this series of blogs in what I call the Epilogue—which will discuss potential gotchas and cautions on interpreting certain aspects of the data and thoughts about how the data could be used constructively.


Comments