Part 1: The 2012 Wilson Research Group Functional Verification Study
Design Trends
In my previous blog, I introduced the 2012 Wilson Research Group Functional Verification Study (click here). The objective of my previous blog was to provide background on this large, worldwide industry study. I will present the key findings from this study in a set of upcoming blogs.
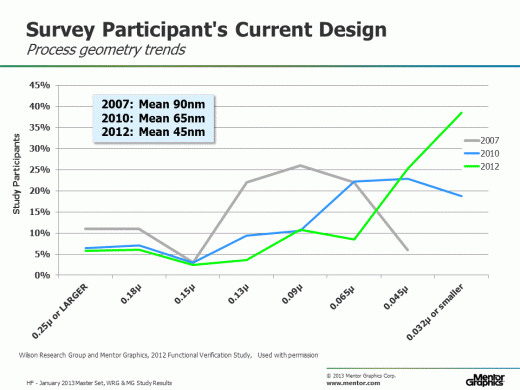
This blog begins the process of revealing the 2012 Wilson Research Group study findings by first focusing on current design trends. Let’s begin by examining process geometry adoption trends, as shown in Figure 1. Here, you will see trend comparisons between the 2007 Far West Research study (gray line), the 2010 Wilson Research Group study (blue line), and the 2012 Wilson Research Group study (green line).
Figure 1. Process geometry trends
Worldwide, the median process geometry size from the 2007 Far West Research study was about 90nm, while the median process geometry size is about 65nm in 2010. Today, the mean process geometry size for a typical project is about 45nm—although you can see that over a third of projects today are designing below 32nm.
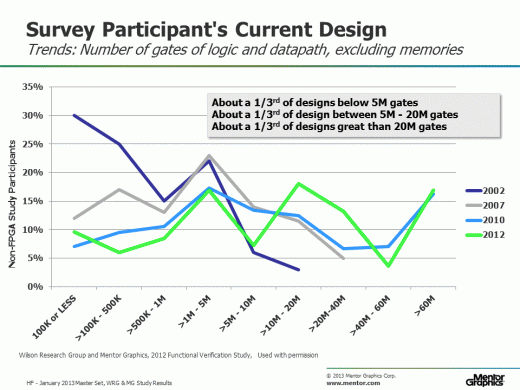
In addition to the industry moving to smaller process geometries, the industry is also moving to larger design sizes as measured in number of gates of logic and datapath, excluding memories (which should not be a surprise). Figure 2 compares design sizes from the 2002 Collett study (dark blue line), the 2007 Far West Research study (gray line), the 2010 Wilson Research Group study (light blue line), and the 2012 Wilson Research Group study (green line).
Figure 2. Number of gates of logic and datapath trends, excluding memories
The study revealed that about a third of the non-FPGA designs today are less than 5M gates, while a third range in size between 5M to 20M gates, and about a third of all designs are larger than 20M gates.
It’s important to note here that the data on the mean design size trends does not reflect volume in terms of semiconductor production. For example, you could have fewer projects designing at a small geometry, yet they have higher volume in terms of production.
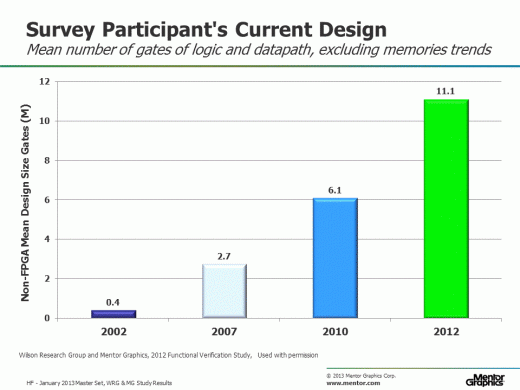
In Figure 3, I show the mean design size trends between the 2002 Collett study (dark blue line), the 2007 Far West Research study (gray line), the 2010 Wilson Research Group study (light blue line), and the 2012 Wilson Research Group study (green line). Obviously, gate counts have increased over the years, yet a significant number of designs continue to be developed with smaller (and larger) gate counts as indicated by the mean calculation. Another observation is that, as you would expect, the mean gate count trend is essentially following Moore’s law.
Figure 3. Mean design size trends
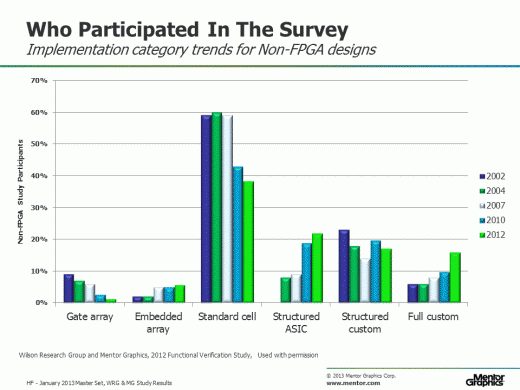
Figure 4 presents the current design implementation trends for non-FPGAs as identified by the survey participants.
Figure 4. Non-FPGA current design implementation trends
The data in Figure 4 presents trends in design implementation approaches for non-FPGA designs, ranging from the 2002 Collett study (dark blue bar), the 2004 Collet study (dark green bar), the 2007 Far West Research study (gray bar), the 2010 Wilson Research Group study (blue bar), and the 2012 Wilson Research Group study (green bar). Note that the study seems to indicate that there is a downward trend in standard cell design implementation.
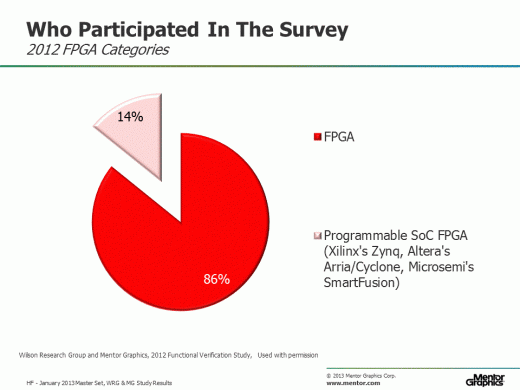
Figure 5. FPGA design implementation trends
For the 2012 study, we decided that we wanted to get a sense of the percentage of FPGA projects that target the very complex programmable SoC FPGAs that have recently emerged, which is shown in Figure 5. Examples of these programmable SoC FPGAs include: Xilinx’s Zynq, Altera’s Arria/Cydone, and Microsemi’s SmarFusion.
In my next blog (click here), I’ll continue discussing current design trends, focusing specifically on embedded processors, power, and clock domains.


Comments