Part 4: The 2010 Wilson Research Group Functional Verification Study
Effort Spent On Verification
This blog is a continuation of a series of blogs, which present the highlights from the 2010 Wilson Research Group Functional Verification Study (click here). In my previous blog (click here), I focused on design and verification reuse trends. In this blog, I focus on the controversial topic of amount of effort spent in verification.
I have been on the technical program committee for many conferences over the past few years (DVCon, DAC, DATE, FDL, HLDVT, MTV . . .), and it seems that there was not a single verification paper that I reviewed that didn’t start with the phrase: “Seventy percent of a project’s effort is spent in verification…blah blah blah.” Yet I’ve always wondered, where did this number come from? There has never been a reliable reference to the origin of this number, and certainly no credible studies that I am aware of.
I don’t believe that there is a simple answer to the question, “how much effort was spent on verification in your last project.” In fact, I believe that it is necessary to look at multiple data points, derived from multiple questions, to truly get a sense of effort spent in verification.
Total Project Time Spent In Verification
To try to assess the effort spent in verification, let’s begin by looking at one data point, which is the total project time spent in verification. Figure 1 shows the trends in total project time spent in verification by comparing the 2007 Far West Research study (in blue) with the 2010 Wilson Research Group study (in green).
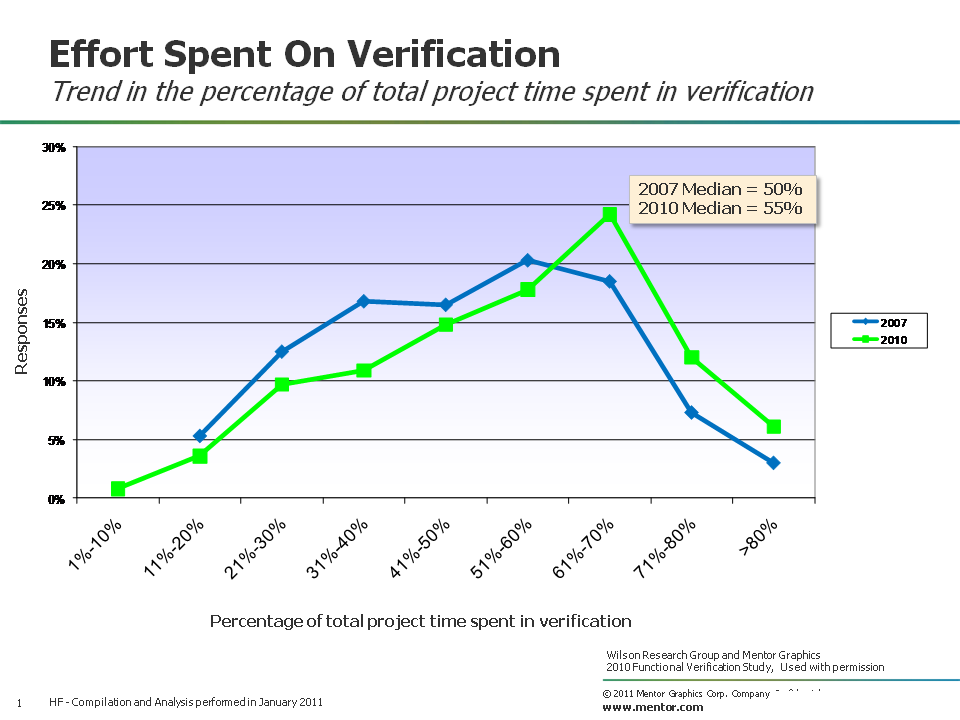
Figure 1. Percentage of total project time spent in verification
Notice that in 2007, the median total project time spent in verification was calculated to be 50 percent, while the number increased to 55 percent in 2010. Our recent study seems to indicate that the time spent in verification is increasing.
Peak Number of Verification Engineers
Next, let’s look at another data point, the peak number of verification engineers on a project. Figure 2 compares the peak number of verification engineers involved on FPGA designs (in grey) and non-FPGA designs (in green) from our recent study.
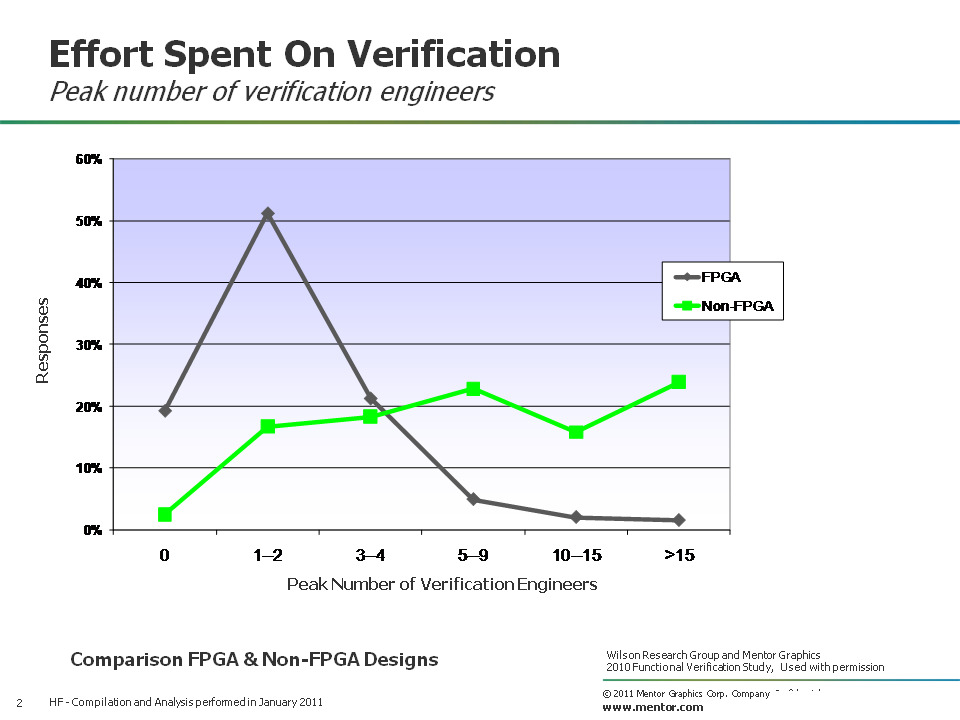
Figure 2. Peak number of verification engineers
It’s not surprising that projects involving non-FPGA designs tend to have a higher number of peak verification engineers compared with FPGA designs.
Figure 3 shows the trends in peak number of verification engineers for non-FPGA designs by comparing the 2007 Far West Research study (in blue) with the 2010 Wilson Research Group study (in green).
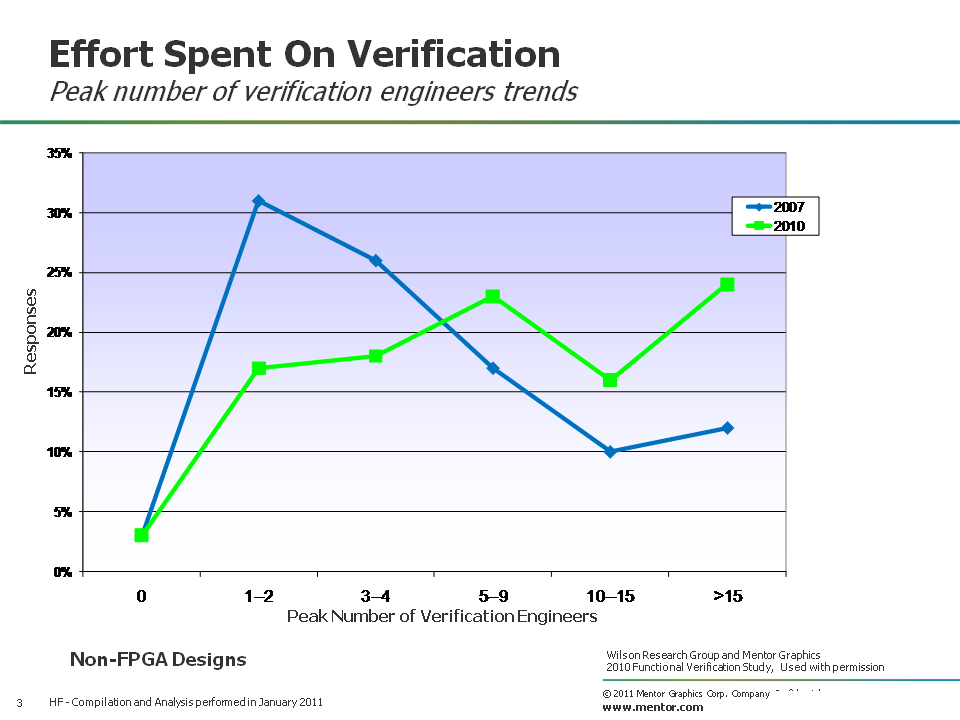
Figure 3. Peak number of verification engineer trends
I decided that another interesting way to look at the data is to partition the set regionally, and calculate the median peak number of verification engineers on a project by region. The results are shown in Figure 4, with North America (in blue), Europe/Israel (in green), Asia (in green), and India (in red).
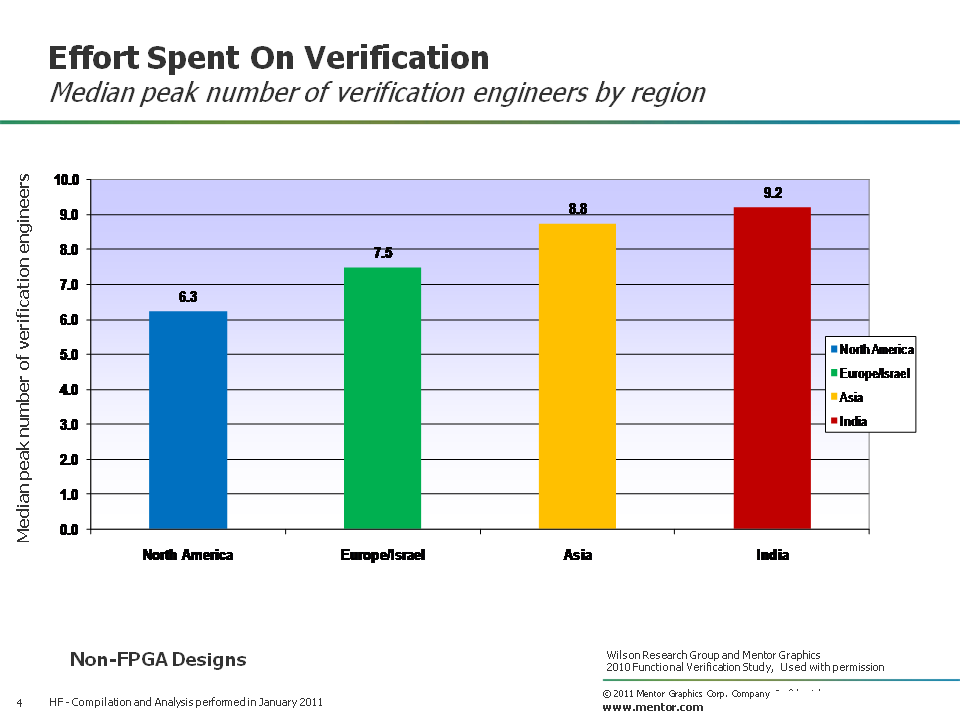
Figure 4. Peak number of verification engineer by region
Noticed how, on average, India seems to have more peak engineers involved on a project. India certainly has developed a core set of expertise in verification over the past few year’s.
The next analysis I decided to perform was to partition the data by design size, and then compare the median peak number of verification engineers. Figure 5 shows the results, where the design size partitions are represented as: less than 1M gates (in blue), 1M to 20M gates (in orange), and greater than 20M gates (in red).
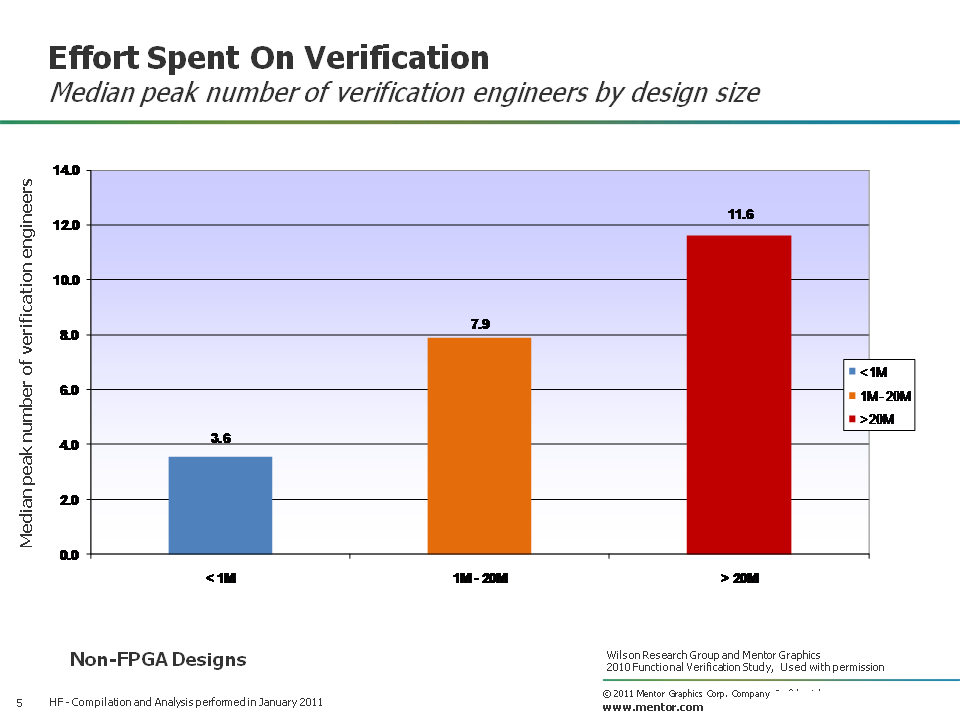
Figure 5. Peak number of verification engineer by design size
Although I am focusing on effort spent in verification at the moment, let’s take a look at the peak number of design engineers involved on a project today. Figure 6 compares the peak number of design engineers involved on FPGA designs (in grey) and non-FPGA designs (in green).
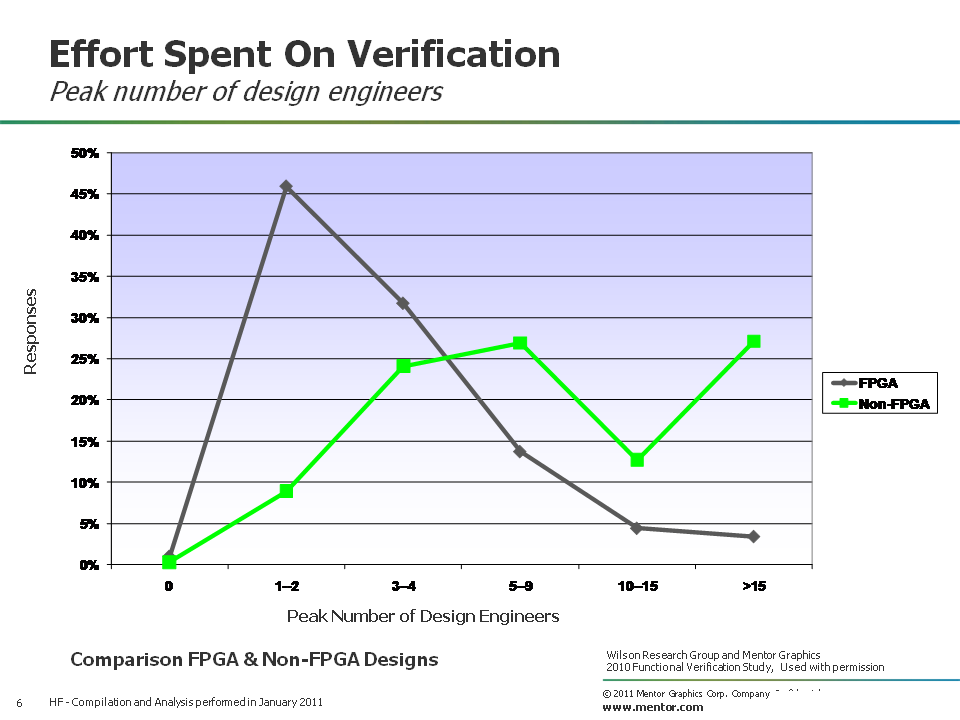 Figure 6. Peak number of design engineers
Next, in Figure 7 I show the trends in peak number of design engineers for non-FPGA designs by comparing the 2007 Far West Research study (in blue) with the 2010 Wilson Research Group study (in green).
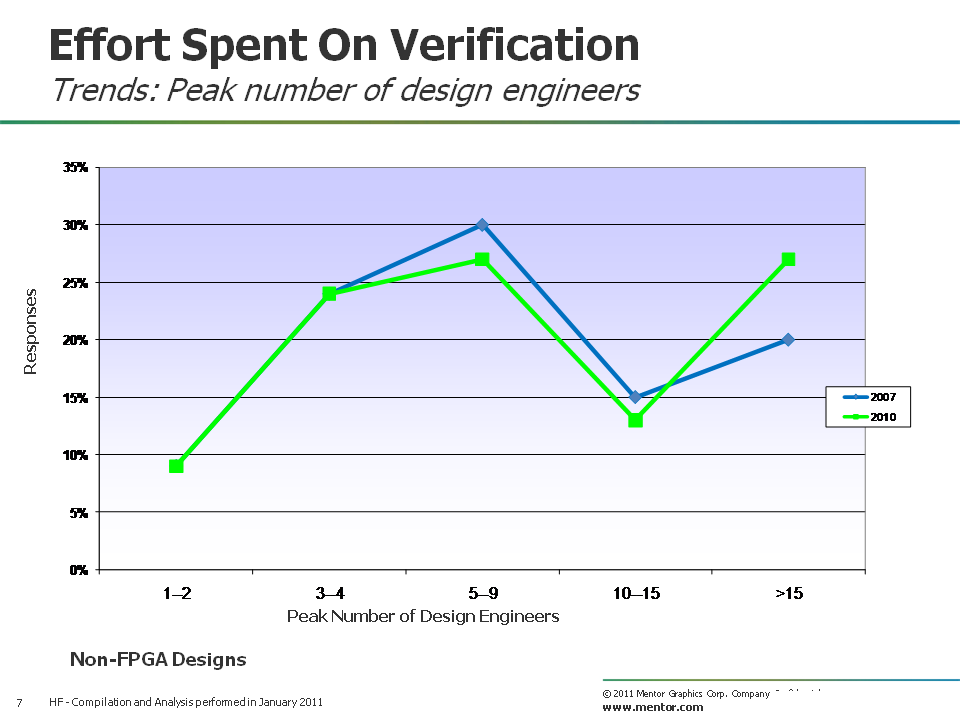
Figure 7. Peak number of design engineer trends
You might note that there has not been a significant increase in design engineers in the past three years, although design sizes have increased. This is partially due to increased adoption of internal and external IP (as I discussed in my previous blog), as well as continued productivity improvements due to automation.
After I saw this data, I thought it would be interesting to compare the median increase in verification engineers to the median increase in design engineers from 2007 to 2010. The results were shocking, as shown in Figure 8, where we see a four percent increase in peak number of design engineers in the last three years compared to a 58 percent increase in peak number of verification engineers. Clearly, verification productivity improvements are needed in the industry to address this problem.
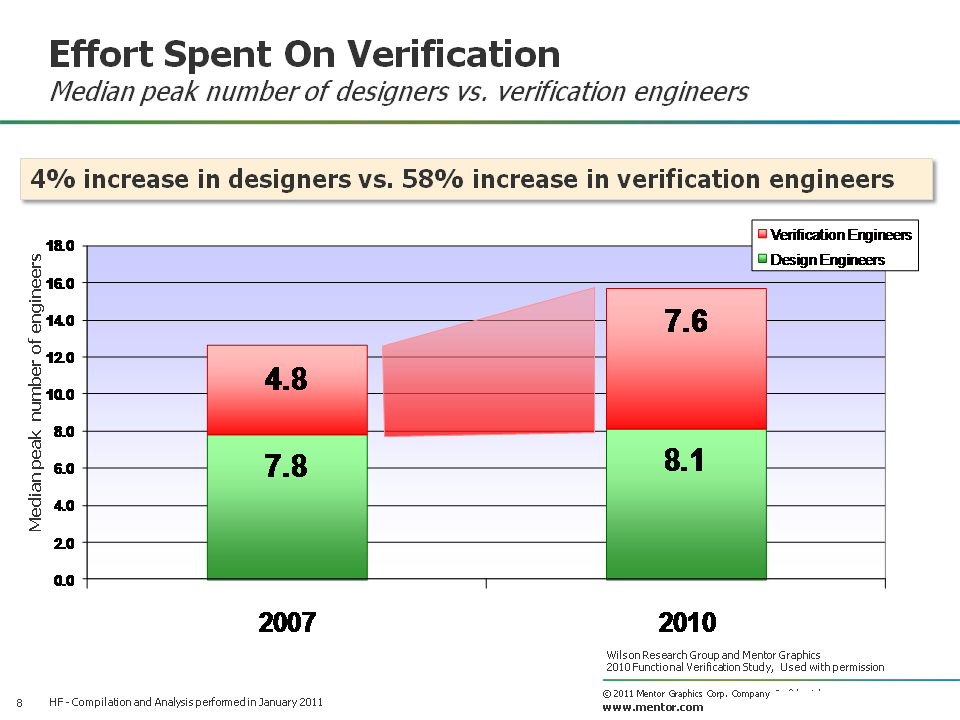
Figure 8. Peak number of design vs. verification engineer trends
In my next blog (click here), I’ll continue the discussion on effort spent in verification as revealed by the 2010 Wilson Research Group Functional Verification Study.