Improve battery fast charging experience while limiting battery aging
Impact evaluation of different fast charging scenarios on battery aging using a system simulation approach
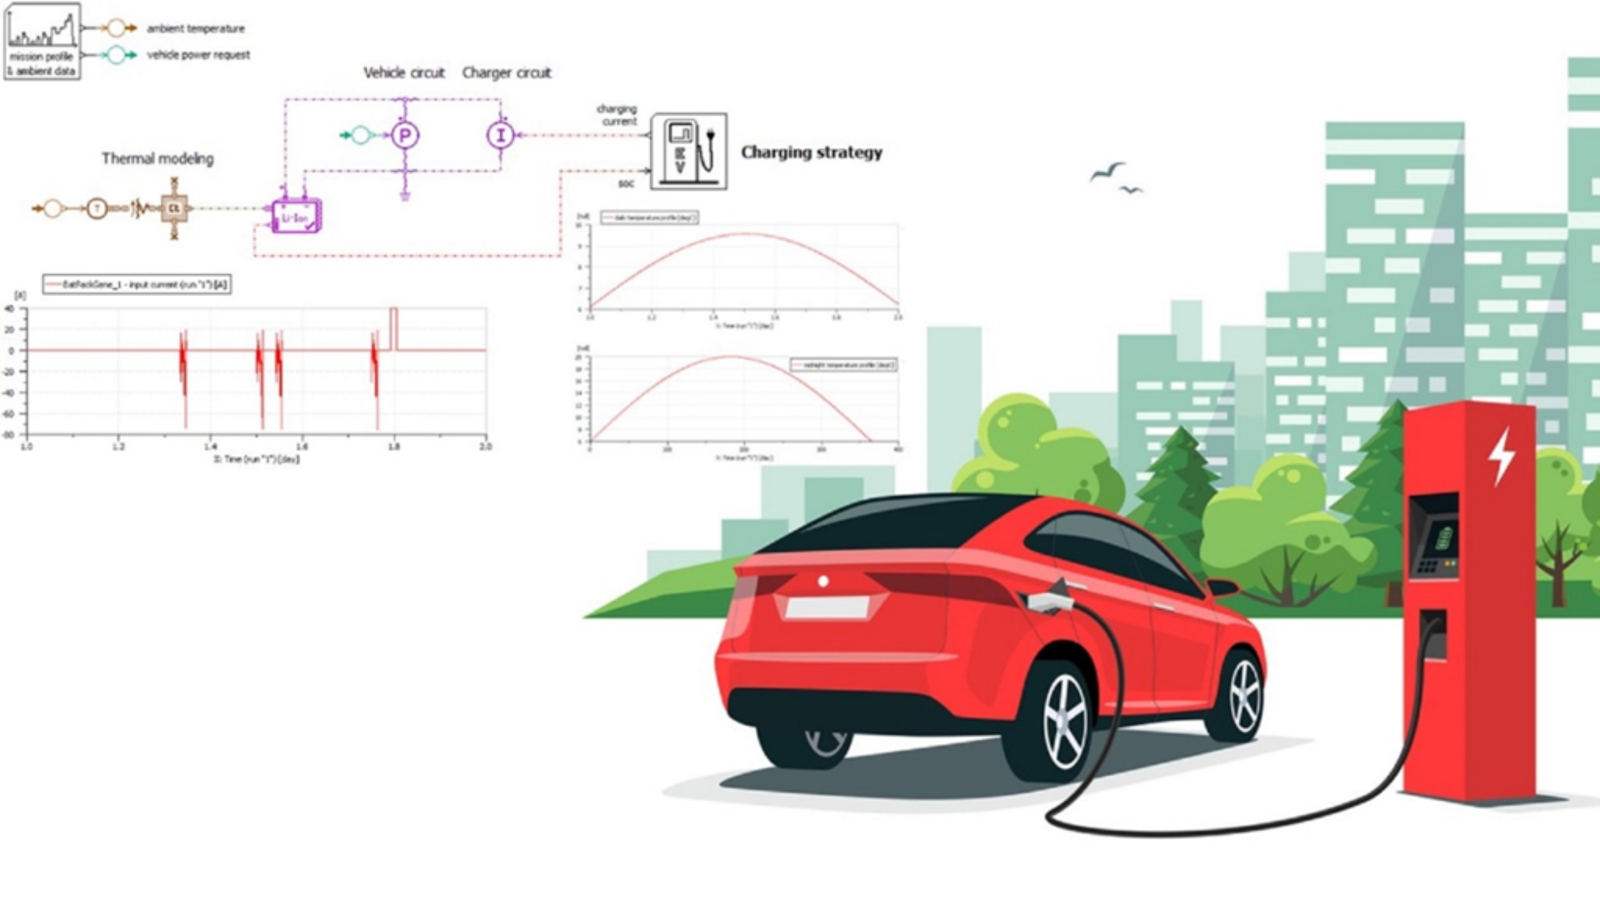
The objective of this article is to show how to improve battery fast charging experience while limiting battery aging. We will present various charging scenarios, their benefits in term of charging time reduction as well as their impact on the aging.
To eliminate range anxiety for electric vehicles, reducing charge time is as critical as deploying high energy density battery packs. In the last few years, auto OEMs and infrastructure companies have been putting increasing emphasis on 150 kW to 350 kW fast charger development and deployment to recharge 80% state of charge (SoC) of battery in 15-30 mins.
On the one hand, to develop robust fast charging systems, it is critical to address a multitude of challenges. For example: high power density power electronics, liquid-cooled cables and connectors, vehicle thermal management system optimization, fast charger integration with an on-site energy storage system. To learn how to optimize the design of an EV fast charger via simulation, take a look at this on-demand webinar on Addressing design and integration challenges for EV Fast Chargers
On the other hand, fast charging puts the battery under stress: increasing the charging current results in a fast increase of the battery temperature, which should always stay below some maximum value such as 45 °C to insure long battery life. Consequently, a cooling circuit needs to be activated to prevent the battery temperature from reaching its maximum temperature, or the charging current must be reduced.
Why is it so difficult to estimate battery lifetime on xEV ?
Battery lifetime depends on a high number of criteria, such as:
- Cell chemistry
- Operating cycles
- Charging cycles
- Thermal conditions
- SOC conditions
In Figure 1, the calendar aging of a NMC-LMO and a Ni-Rich NMC-Ni Lithium-ion batteries are compared, for various temperatures at 80% SOC (reference: “Experimental protocols and first results of calendar and/or cycling aging study of lithium-ion batteries – the MOBICUS project”, Mohamed Ben-Marzouk et al, EVS29 Symposium Montréal, June 19-22, 2016).
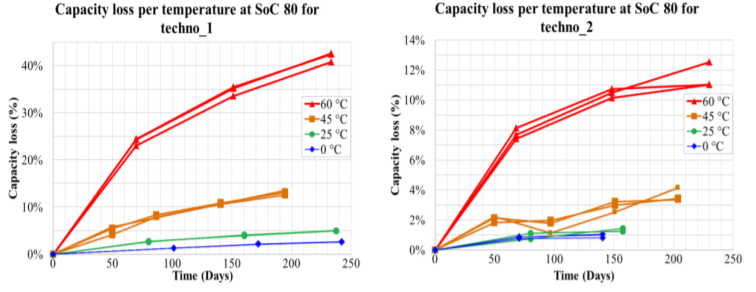
Figure 1: Capacity loss for each technology at SoC 80% (pure calendar aging tests)
Figure 2 presents another example in which the same type of battery cells have been tested for a period of two years to measure the calendar and cycling aging around a SOC (reference: “Strategies to extend the lifespan of automotive batteries through battery modeling and system simulation – The MOBICUS Project”, Sofiane Belaid and al., 2017 IEEE Vehicle Power and Propulsion Conference (VPPC)).
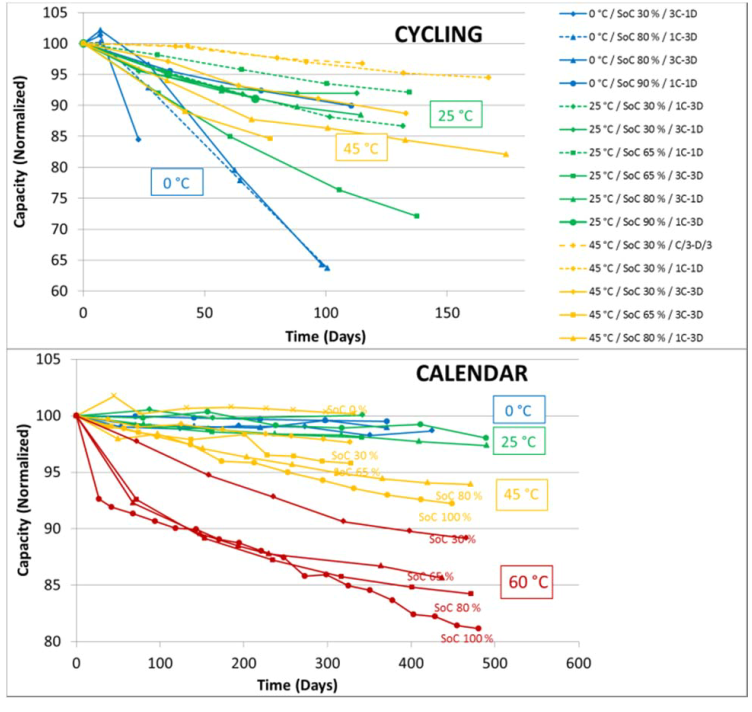
Figure 2: Capacity loss for calendar and cycling conditions
In this last example (Figure 3), one can see the impact of various charging strategies on the capacity loss for 2 different cell chemistries (reference: Simcenter Amesim demo).
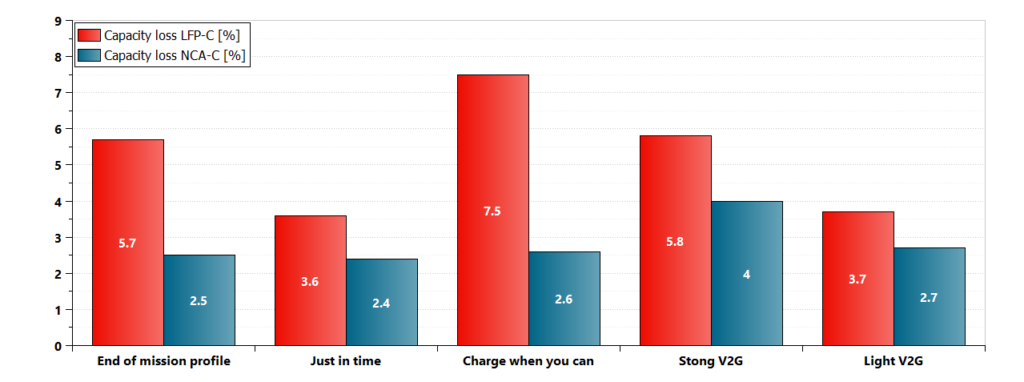
Figure 3: Capacity loss for 2 cell chemistries and various charging strategies
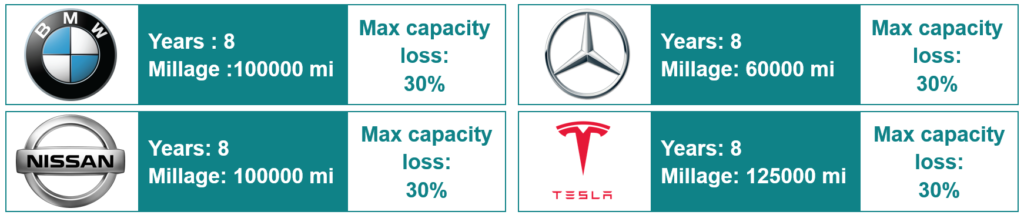
Usually, car batteries are covered by the OEMs for a certain period and mileage.
Let’s now have a look at how system simulation can support OEMs to estimate the capacity loss of a battery for a given cell technology, charging strategy and cooling power.
Battery cell under consideration
Among Li-ion batteries, Ni0.8Co0.15Al0.05O2 – graphite (NCA-C) cells show interesting quality in automotive applications since they have good energy storage capacity compared to other typical chemistries. This cell has been tested with current profiles in Figure 4:
- At 25 °C ambient temperature, the test bench performing a Hybrid Pulse Power Characterization (HPPC) profile and a road profile using specific input current patterns usually obtained during Hybrid Electric Vehicle (HEV) operations.
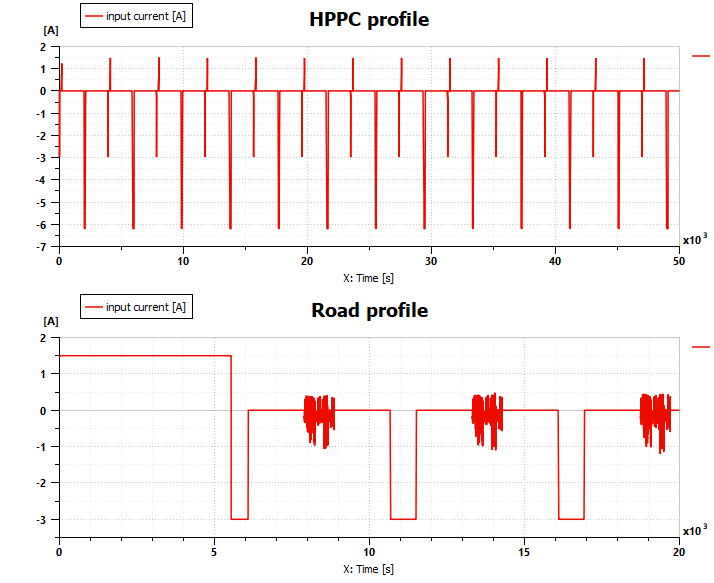
Figure 4: Current profile used for HPPC and HEV tests
- Using a test matrix of conditions allowing to have a large panel of data to calibrate an aging model at 25 °C temperature from 20 to 60% of SOC: cells were cycled around +/- 5% of these average SOC, in order to have a ΔSOC of 10%. Check-ups have been performed at several times in order to measure the residual capacity of every cell.
Hereunder you can find the main characteristics of this 2.95 Ah NCA-C cell:
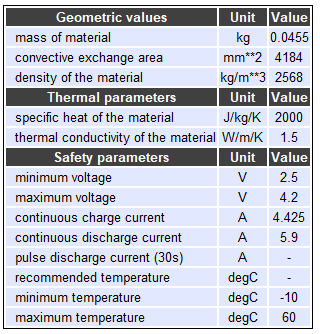
Figure 5: NCA-C cell characteristics
A dynamic equivalent circuit model is used, simulating both electrical and thermal behaviors of the cell. The model has been calibrated and validated by experimental tests data from IFP Energies Nouvelles battery tests facilities. The reversible and irreversible heat exchanges are considered for the thermal energy balance.
Figure 6 shows the comparison of cell voltage between the experimental measurements and the simulated results. The model describes correctly the electrical and thermal behaviors of the cell for the HPPC and the road profiles.
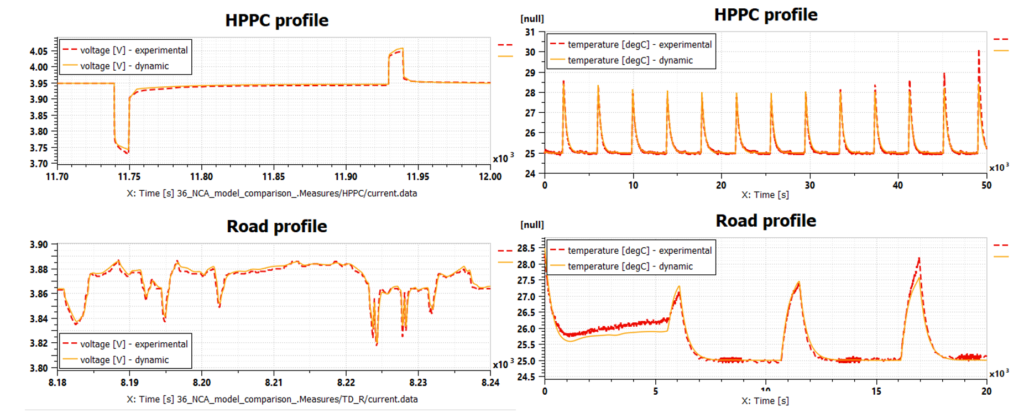
Figure 6: Comparison between experimental and simulated voltage and temperature
A semi-empirical dynamic aging model has been developed combining both cycling and calendar aging phenomena.
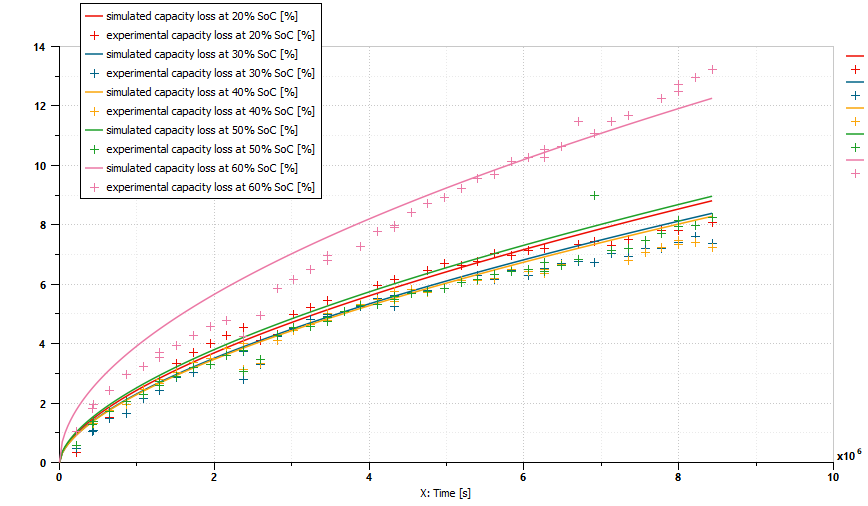
Figure 7: Comparison between experimental and simulated capacity loss at 25°C
The comparison shows that the cell aging model gives a good prediction on the capacity loss with less than 0.5% of error in a 13% range. The laws used to express calendar and cycle aging have been derived from [Wang et al. (2011)] and [Revel et al. (2012)], and the parameters can be fitted to experimental data as it was done by [Prada et al. (2013)].
As a summary of the aging tests on this NCA-C cell, calendar aging is mainly dependent on the SOC and the temperature, while the cycling aging is strongly dependent on the value of the charge/discharge current.
Impact of cell temperature on aging: simulation results
To improve battery fast charging experience while limiting battery aging, we need to evaluate the impact of cell temperature on aging. To do so, a first simulation has been performed by changing the cell temperature. Like during experiments, the cell was cycled around +/- 5% of an average SOC of 60%. We clearly see the exponential impact of the temperature: the capacity loss increasing from 10% at 25°C to 18.7% at 45°C.
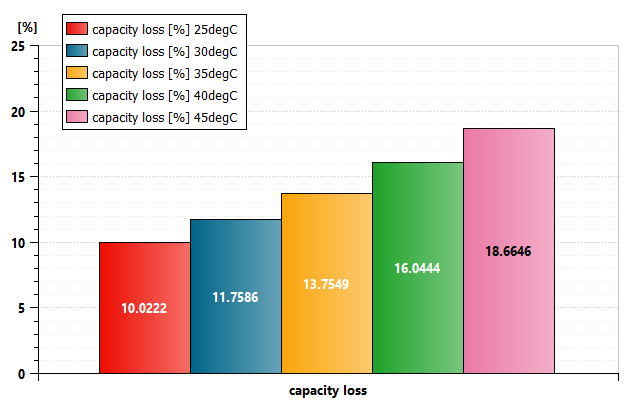
Figure 8: Impact of cell temperature on aging (simulation results)
Comparing CC-CV to MSCC with the same charging duration
In the following scenario, we are comparing two charging strategies:
- The first one is a CC-CV charging scenario. It starts with a constant current (CC) of 1C applied to the battery cell, followed by a reduction of current to maintain a constant voltage once the voltage has reached 4.2V. This strategy is considered as the reference charging cycle for all other comparisons.
- The second one is a MSCC strategy (Multiple Step Constant Current). A constant charging current is set until a target SOC or voltage is reached and is followed by a reduced current step. Here, steps of 1.5C until 45% of SOC, 1C until 75% of SOC then 0.5C are defined, to have the same charging duration (roughly 50 min). The objective is to reduce the current at high SOC/voltage to limit lithium deposit.
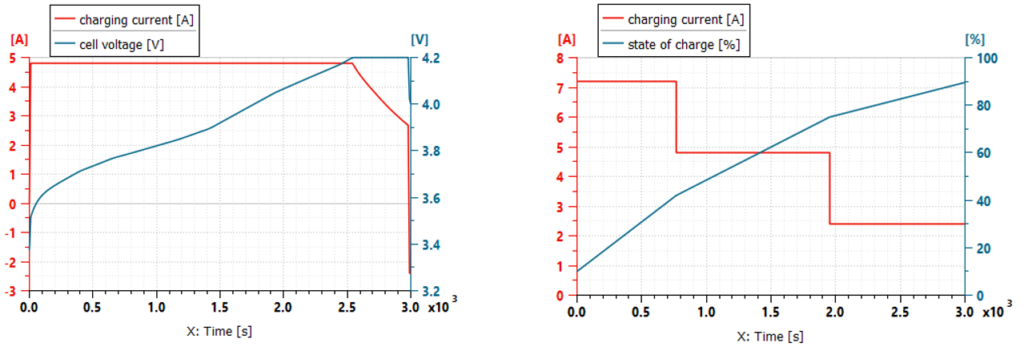
Figure 9: CC-CV versus MSCC, charging profiles
To compare these charging strategies, we apply the following protocol:
- Charging from 10% to 90% of SOC, then discharging at 0.5C, this being repeated for 8 years (roughly 3000 cycles)
- Thermal: constant Heat Transfer Coefficient of 25W/m2/°C, external temperature of 25 °C
Looking at the simulation results, we can first conclude that for this cell technology, the MSCC protocol brings no value:
- higher cell temperature level
- negative impact on aging (+8% on capacity loss)
- very small benefit on the electrical charging power consumption (-1%)
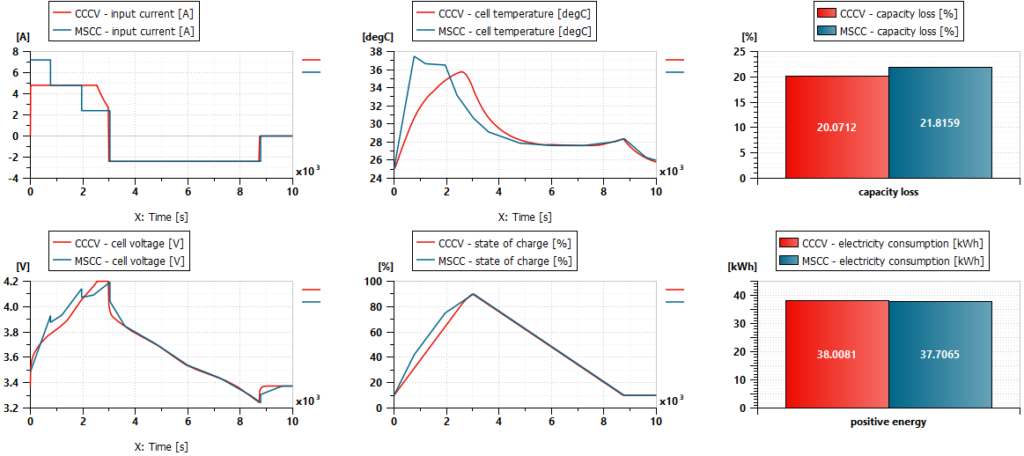
Figure 10: CC-CV versus MSCC, simulation results
Comparing CC-CV with a new MSCC strategy to reduce the charging time
Here, the Multiple Step Constant Current strategy was modified to decrease the charging time: we maintain a current of 2C until 50% SOC, then we apply a current of 1C. The objective is to maintain the temperature of the cell under 45°C.
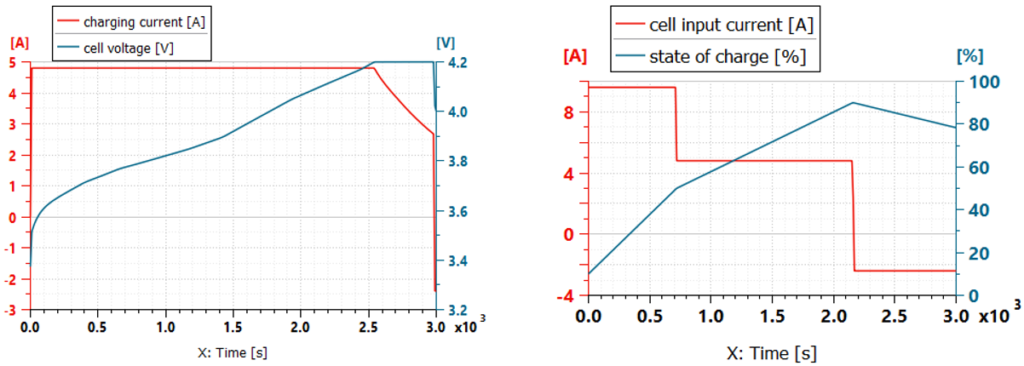
Figure 11: CC-CV versus MSCC-2C, charging profiles
Comparing with the initial CC-CV scenario, the charging time is decreased by 27% (2980s/50 min vs 2200s/36 min), but capacity loss is increased by 38% (from 20.1% to 27.7%). At the same time, the electrical power consumption is slightly decreased by 3% (from 38.2kWh to 36.8kWh)
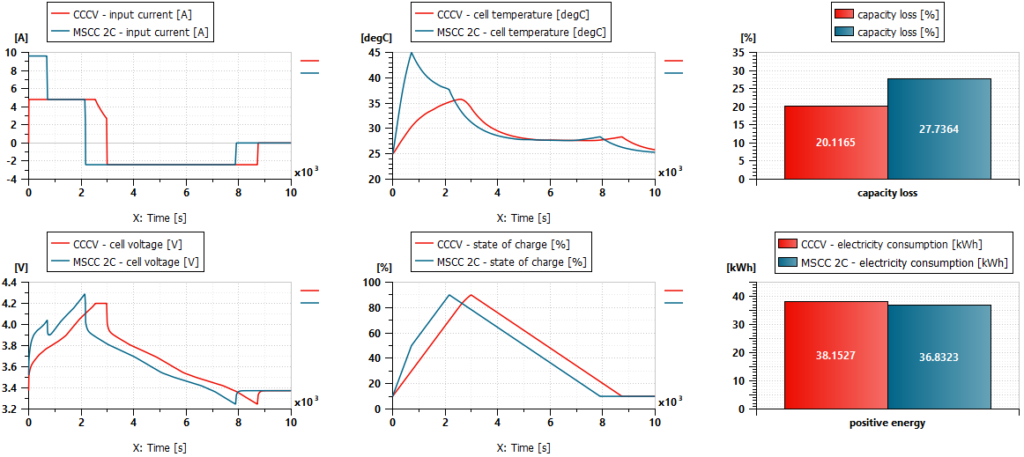
Figure 12: CC-CV versus MSCC-2C, simulation results
Comparing CC-CV with a 2C constant current strategy with enhanced cooling
In order to maintain a constant charging current of 2C and limit the temperature of the cell to 45 °C the cooling loop must be enhanced with a Heat Transfer Coefficient increase to 45W/m2/°C (for an ambient temperature of 25 °C). With this new scenario, the charging time is strongly decreased by 50% (2980 s/50 min vs 1450 s/24 min), but the capacity loss increased by 67% (from 20.1% to 33.6%).
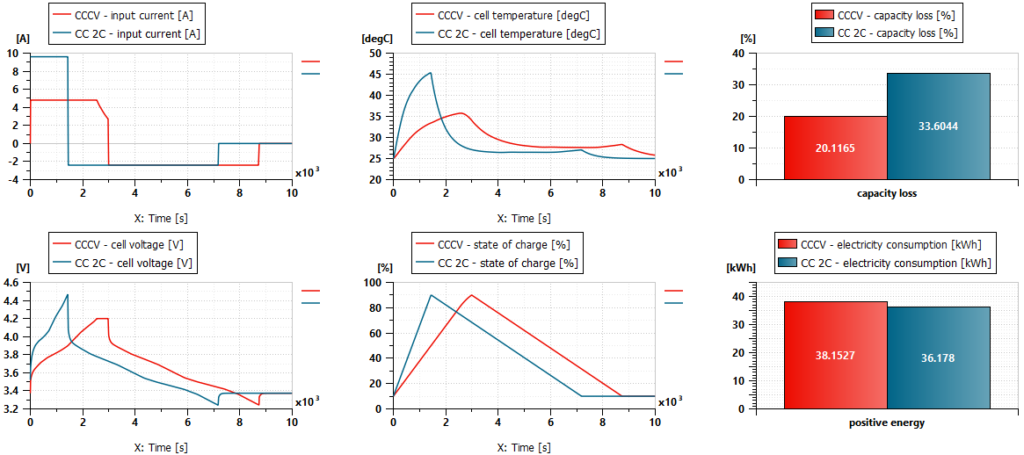
Figure 12: CC-CV versus CC@2C, simulation results
Conclusion
The faster you charge your battery, the faster it degrades. This is obvious, but the examples described in this blog allows you to put some numbers in order to select wisely your charging profile and the impact it will have on capacity fading, and therefore on the battery warranty. As a conclusion, we clearly see the interest of system simulation to improve battery fast charging experience while limiting battery aging.
Going further: cell geometry optimization for fast charging scenario
Cell geometrical design can be also optimized to reach an optimal compromise between charge speed, cell temperature, and battery aging. The following on-demand webinar will demonstrate the use of system simulation technology as well as detailed cell electrochemical modeling to perform sensitivity analysis on fast charging scenarios: “Optimizing the battery charging experience“
You will learn:
- Battery pack requirements definition using system simulation
- Cell geometry optimization for fast charging scenario
- Sizing and validation of a cooling loop with a chiller to cool down the battery during fast charging, using system simulation
Read more
Check out the new features of Simcenter system simulation solutions version 2020.2 in this blog post.
References
- J. Wang, P. Liu, J. Hicks-Garner, E. Sherman, S. Soukiazian, M. Verbrugge, Ha. Tataria, J. Musser, P. Finamore, “Cycle-life model for graphite-LiFePO4 cells”, Journal of Power Sources, Volume 196, Issue 8, 15 April 2011, Pages 3942-3948, ISSN 0378-7753
- E. Prada, M. Petit, “Aging modeling for advanced Li-ion battery pack sizing and management for HEV/EV through AMESim simulation platform”, LMS Vehicle Conference France 2013.
- R. Revel, J. Bernard, A. Delaille, P. Gyan, “Studies and modeling of the calendar aging of HEVs and EVs Li-ion cells: Simcal project”, Batteries 2012
- Mohamed Ben-Marzouk , Agnès Chaumond , Eduardo Redondo-Iglesias , Maxime Montaru and Serge Pélissier, “Experimental protocols and first results of calendar and/or cycling aging study of lithium-ion batteries – the MOBICUS project”, EVS29 Symposium Montréal, Canada, June 19-22, 2016)
- Sofiane Belaid, Remy Mingant, Martin Petit, Joseph Martin, Julien Bernard, Strategies to Extend the Lifespan of Automotive Batteries through Battery Modeling and System Simulation: The MOBICUS Project, 2017 IEEE Vehicle Power and Propulsion Conference (VPPC)