Simplifying rotating machinery testing in Simcenter Testlab Neo

Understand rotating machinery performance to prevent failure
In today’s rapidly advancing industrial landscape, the ability to accurately capture and analyze rotating machinery performance has become more critical than ever. Operational data acquisition from rotating machinery isn’t just another checkbox in maintenance procedures, it represents the cornerstone of equipment health management and operational efficiency. Whether managing sophisticated turbines, industrial compressors or electric motors, understanding the operational dynamics serves as the fundamental basis for preventing costly downtime and ensuring optimal performance throughout the equipment lifecycle.
Simcenter Testlab Neo: The software platform for multiphysics data acquisition
Recognizing the complex challenges faced by industry professionals, we have developed a solution that transforms the approach to machinery testing. Our next-generation data acquisition and analysis software, Simcenter Testlab Neo, introduces a dedicated workflow that bridges the gap between novice users and seasoned professionals. This innovative platform represents a significant advancement in how we capture and analyze multiphysics operational data, including sound, vibration, strain, current, temperature and speed measurements.
Simcenter SCADAS hardware: Optimized for precision and flexibility
At the heart of our testing solution lies the Simcenter SCADAS, a state-of-the-art data acquisition hardware system that exemplifies versatility and precision. This powerful multi-channel system has been specifically engineered for multiphysics measurements, offering flexibility through its broad range of compatible modules. The system’s ability to condition both analog and digital signals makes it an ideal choice for comprehensive machinery testing applications.
From solution to implementation: The critical connection
While robust hardware and the software for data acquisition & analysis form the foundation of our testing solution, the true value emerges in how we implement this technology to solve real-world challenges. Industrial machinery testing demands more than just reliable equipment: it requires a thoughtful integration of hardware and software capabilities with practical application needs. This is particularly crucial when understanding the dynamic behavior of rotating machinery, where multiple physical phenomena must be captured simultaneously to build a complete picture of machine dynamics.
The following measurement setup demonstrates how we transform these theoretical advantages into practical solutions.
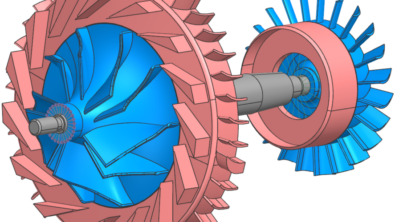
The measurement setup: A detailed look
Our rotating machinery testing measurement setup includes a Siemens E-motor and a SINAMICS drive, connected to an air valve. We use three types of speed sensors: an optical sensor pointing to a zebra tape, a magnetic pick-up pointing to a gear with 2 missing teeth and an incremental encoder at the motor’s end. We’ll later compare and process the data collected from these sensors to analyze their different dynamic content.
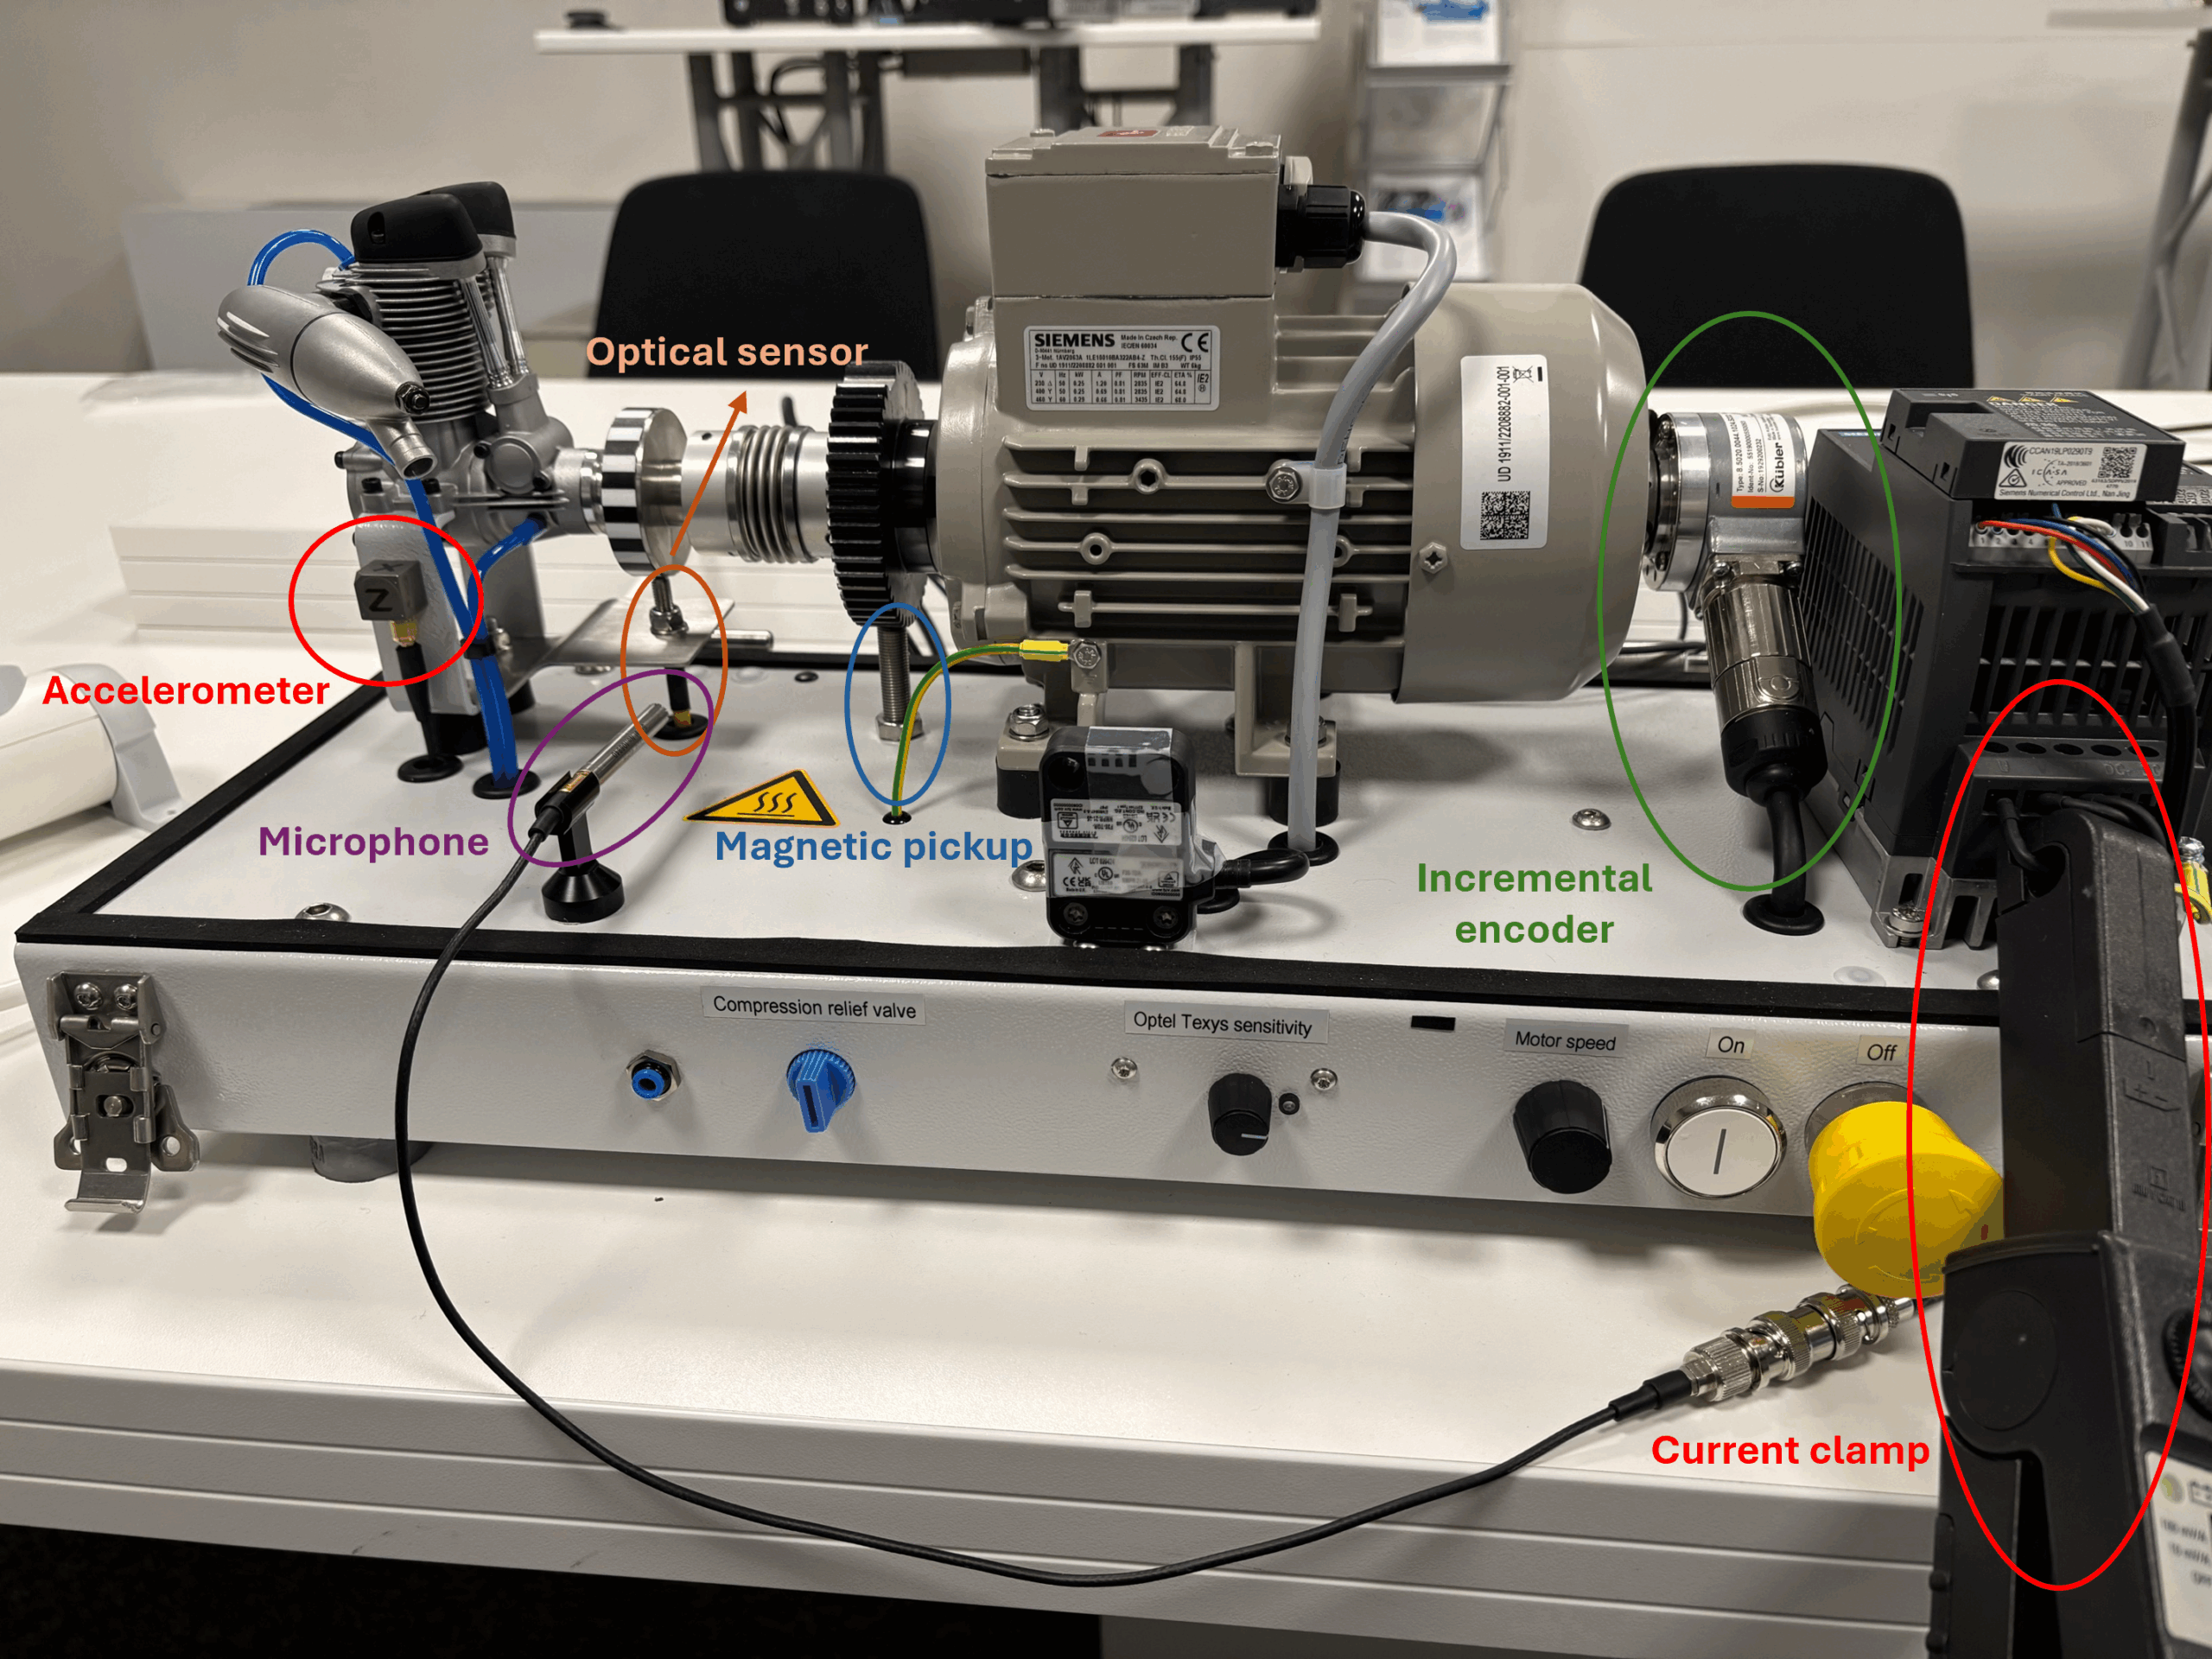
In addition to speed measurements, a microphone is placed near the air valve to measure the sound during operation. We will also measure the acceleration on the bracket carrying the air valve via a triaxial accelerometer. Last but least, the current going to the motor is measured using a current clamp.
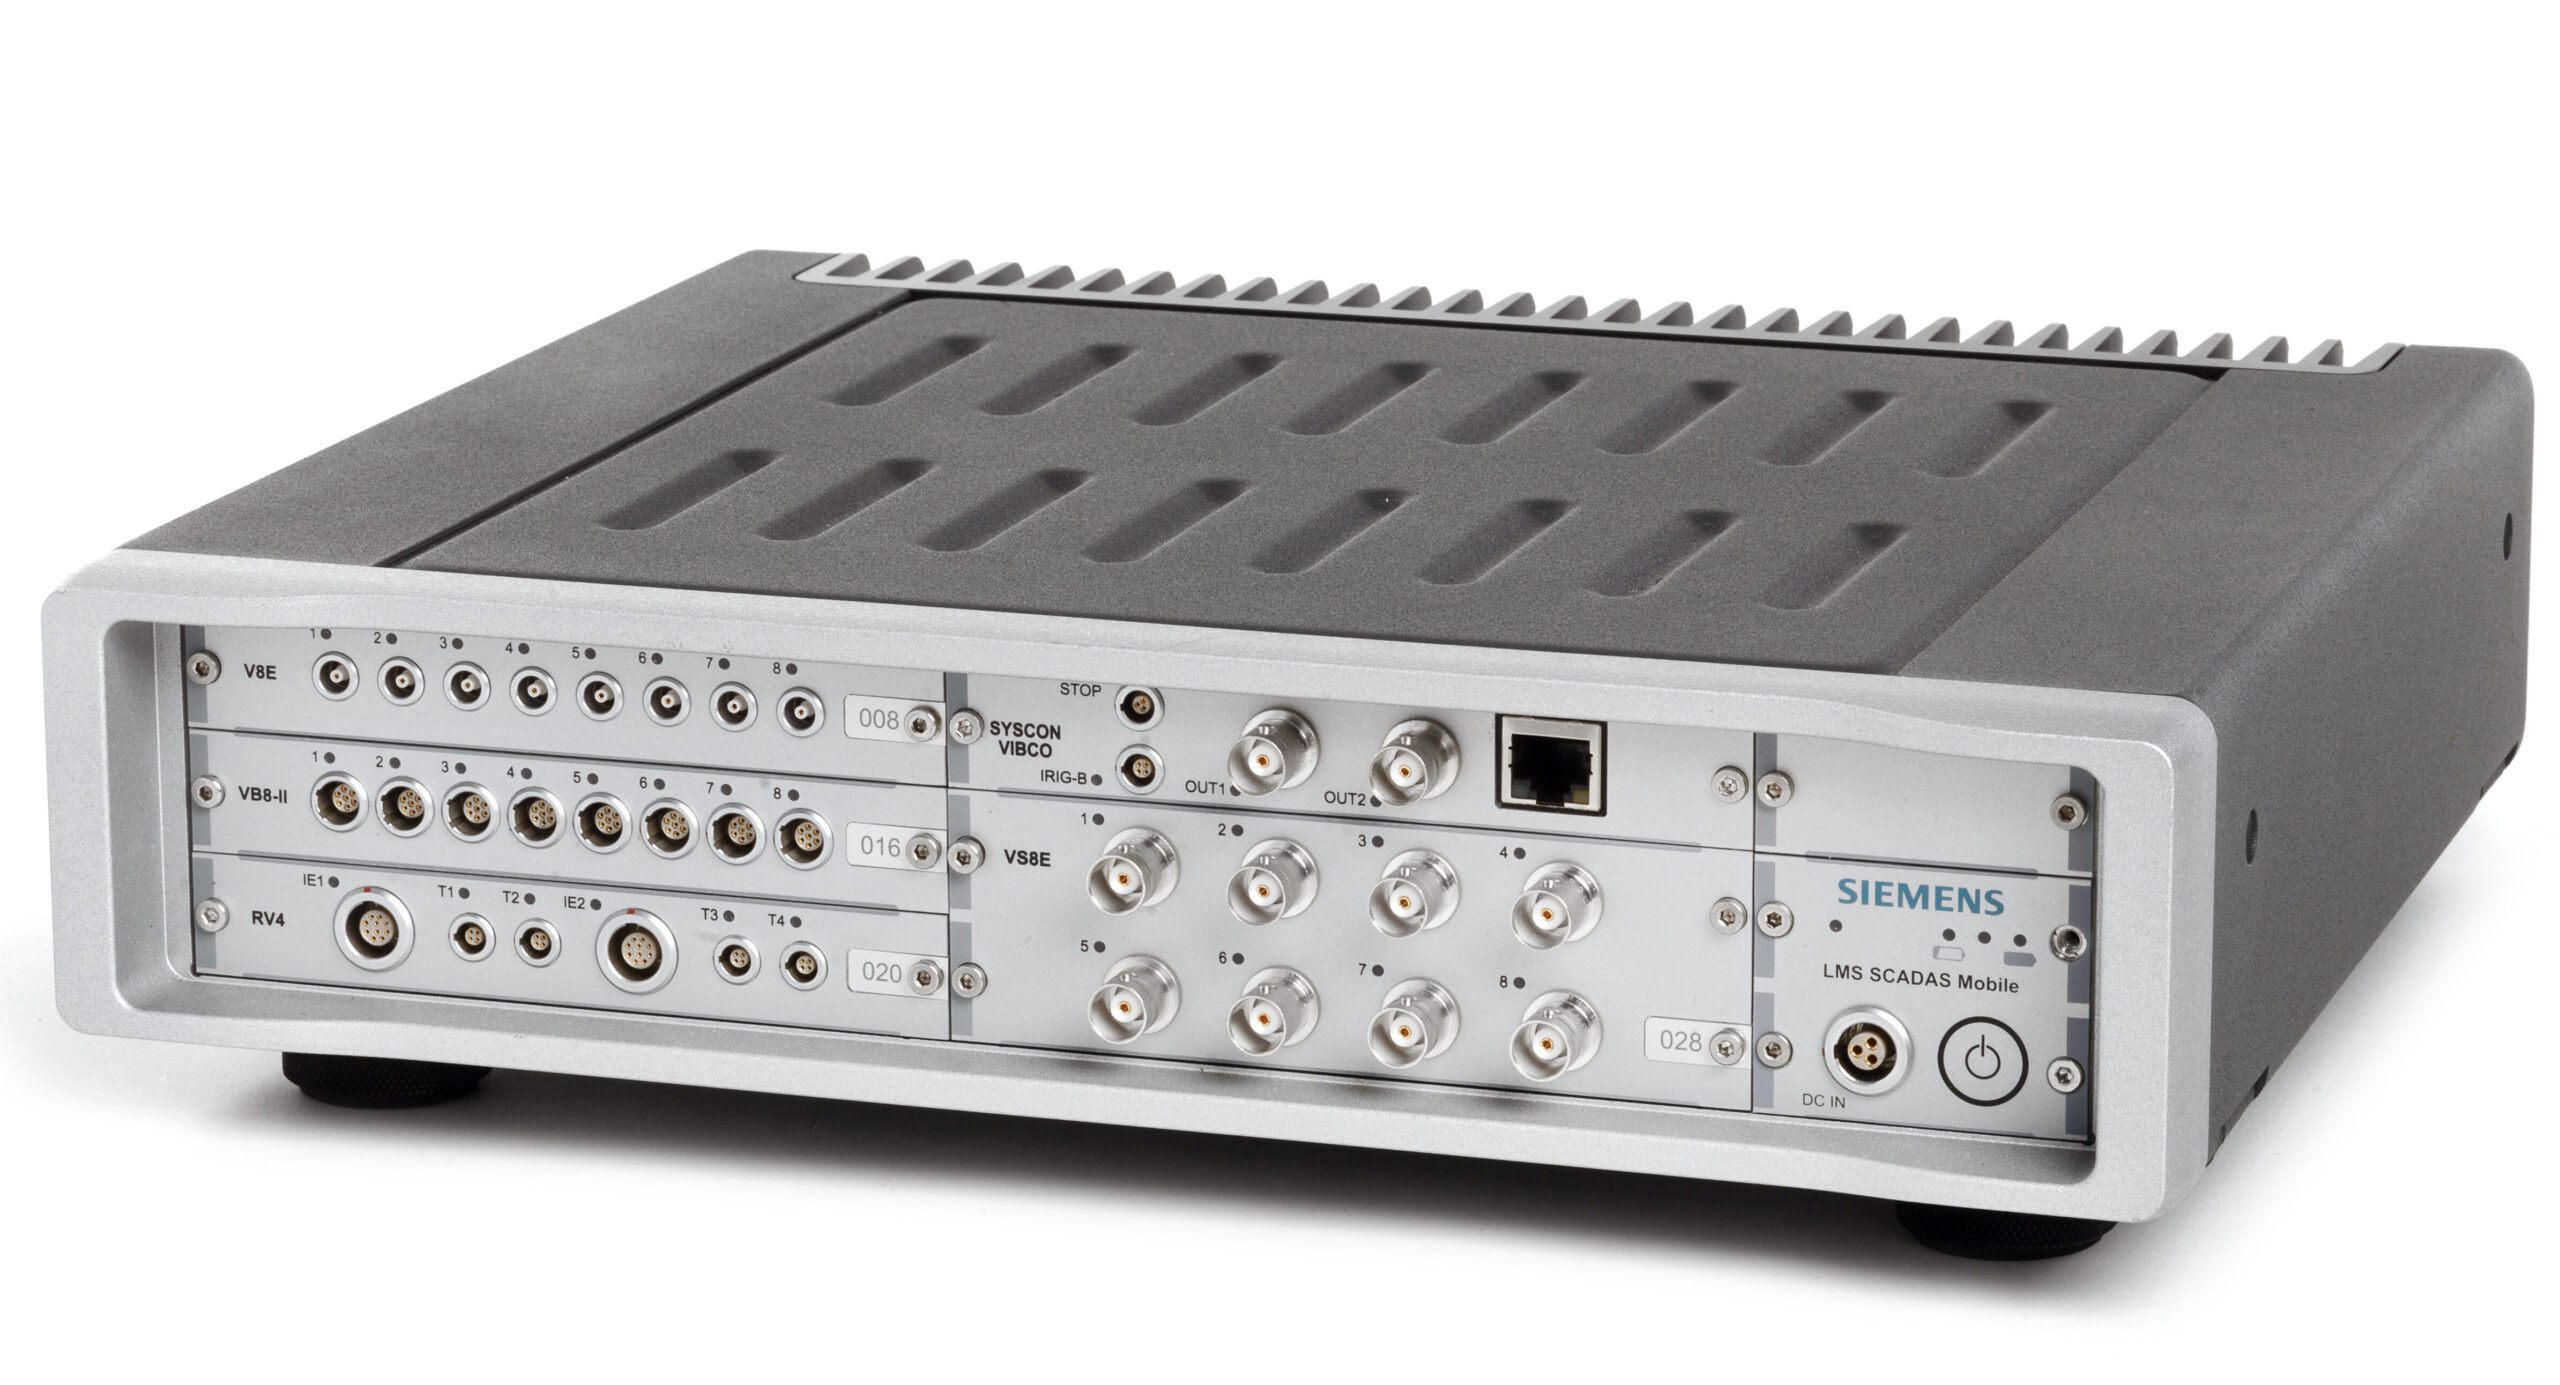
We will use a Simcenter SCADAS Mobile as the data acquisition hardware. It is a compact, multi-channel system which is ideal for multiphysics measurements. In addition to its compactness, it allows for a broad range of modules that supports conditioning of analog and digital signals as mentioned earlier.
From sensors to signals: Optimizing channel setup
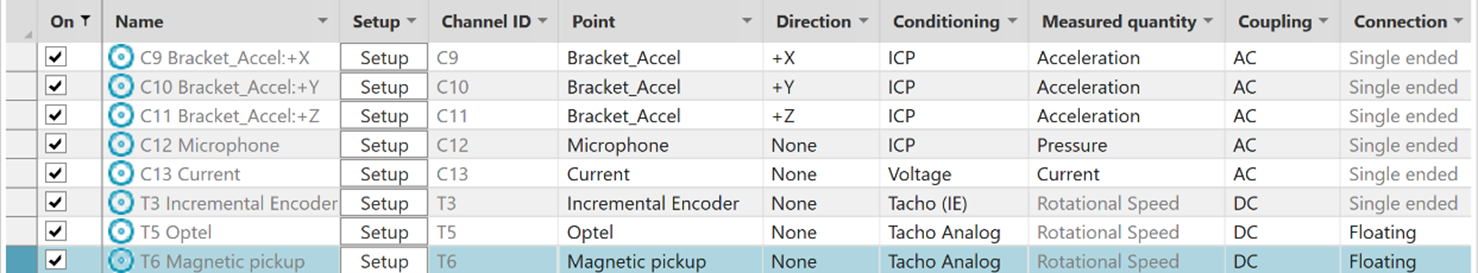
The journey from sensor to insight begins with proper channel setup, a critical phase that Simcenter Testlab Neo has refined into an intuitive yet powerful process. When users first launch the Time Data Acquisition workbook and navigate to the Channels tab, they’re greeted by a thoughtfully designed grid interface that transforms complex instrumentation setup into a manageable task. This interface serves as a central command center where engineers can efficiently manage all aspects of their transducer configuration from point identification to sensitivity settings. What truly sets this system apart is its adaptability to different user needs and expertise levels.
Engineers can tailor the view to their specific requirements, showing only the parameters relevant to their current testing scenario. For instance, when configuring multiple sensors such as a triaxial accelerometer, microphone or current clamp, users can easily input and adjust parameters like conditioning settings, measured quantities and coupling options. This flexibility proves particularly valuable during complex setups involving multiple sensor types.
Since our setup contains a speed magnetic pickup measurement on a gear with two consecutive missing teeth, a missing pulse correction algorithm is needed. We can set this up easily while on the Channels tab via the channel properties and this correction will be made while measuring.
The interactive data visualization interface under the Setup tab adds another dimension of confidence to the setup process: engineers can verify each channel’s functionality in real-time, observing both time and frequency data as they make adjustments. This immediate feedback loop ensures that any parameter changes or system responses are instantly visible, allowing for quick troubleshooting and optimization before the actual testing begins. Such attention to detail in the channel setup phase pays dividends throughout the testing process, ensuring data quality and measurement reliability from the very start. In the below video, we see the effect of speed change on different sensors without having to make any measurements.
Let’s measure: Interactive signature monitoring
The system’s sophisticated capabilities are matched by its straightforward operational workflow. Starting a measurement session is remarkably straightforward: users simply arm the Simcenter SCADAS hardware, select their desired monitoring functions and begin collecting data. This streamlined process ensures that teams can focus on the analysis rather than wrestling with complex setup procedures.
Transforming data into insights
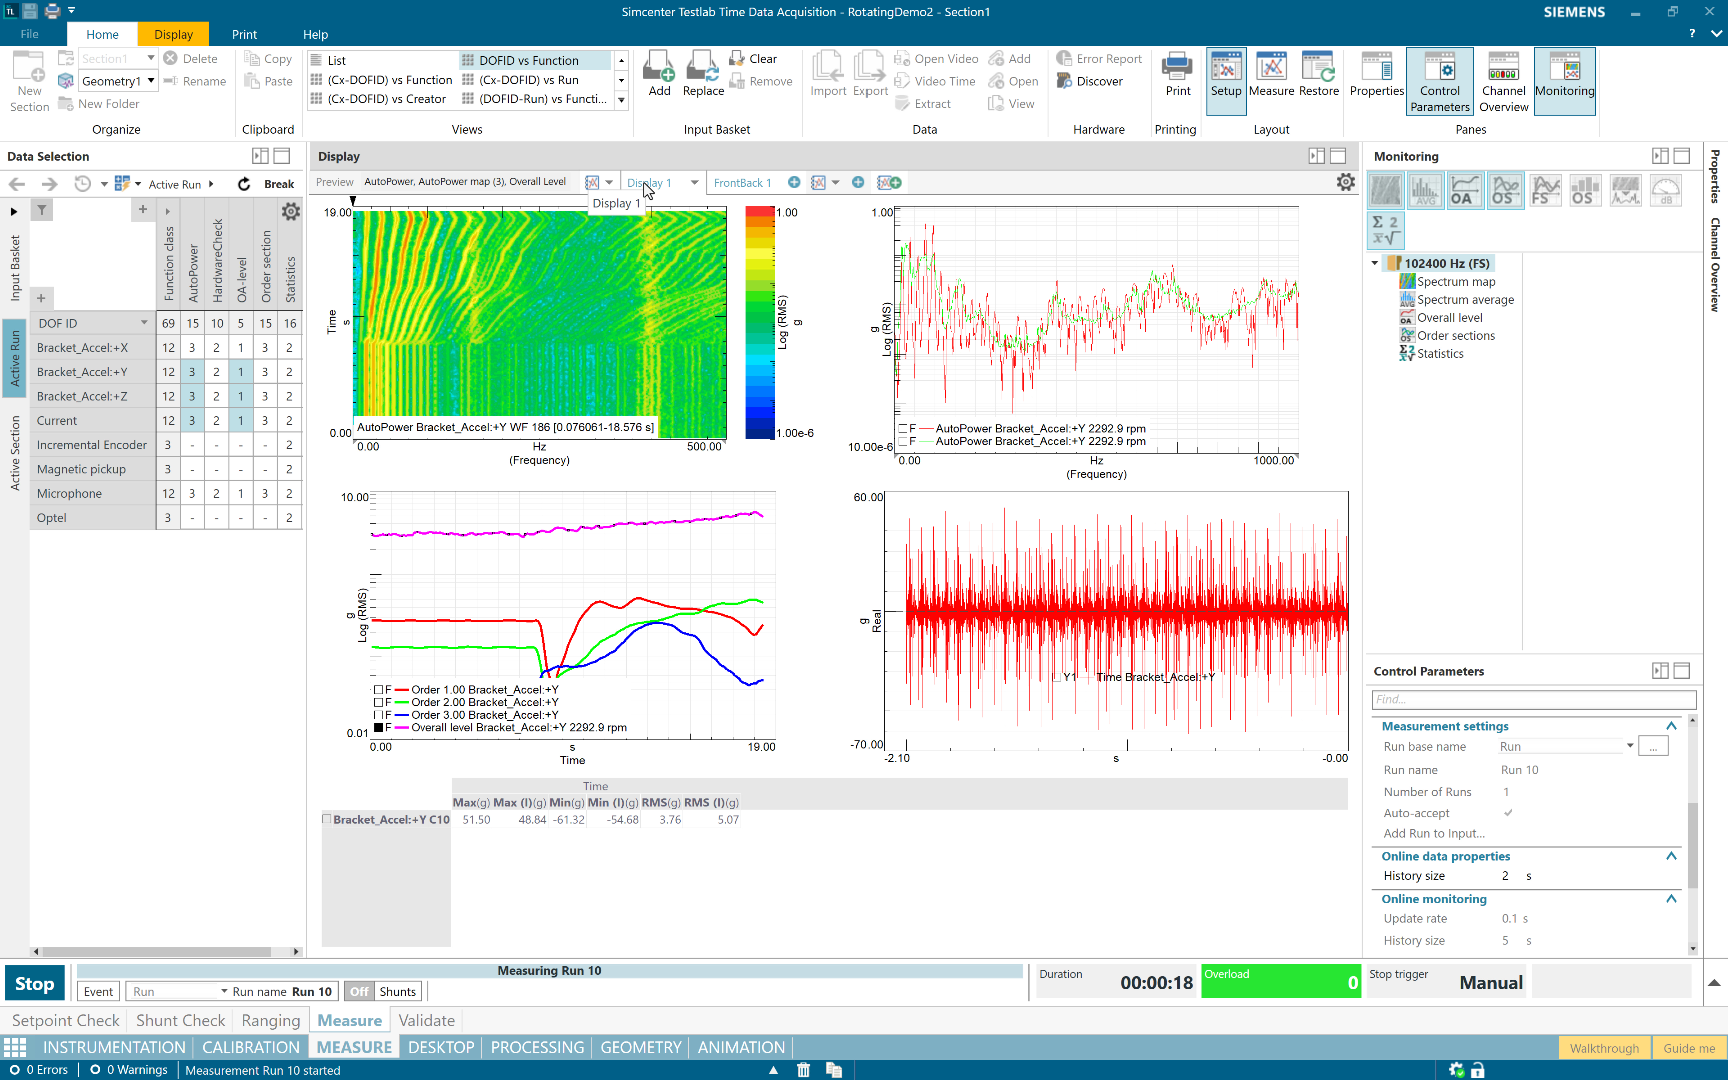
The system’s true strength lies in its real-time data processing capabilities. Through the Measure sheet interface, engineers access immediate time traces and monitoring functions, transforming raw data into actionable insights as it’s collected. The system continuously processes incoming information, calculating statistics, generating spectra and monitoring overall levels with remarkable efficiency.
What sets this solution apart is its flexible data presentation. Engineers can create customized display layouts that align with their specific analysis needs, enabling standardized viewing configurations that support established testing protocols. Real-time visualization of acoustic and vibration signatures eliminates blind data collection, allowing immediate adjustments based on live feedback and significantly reducing the need for retesting. When anomalies appear, teams can respond instantly, ensuring data quality from the start.
More to come
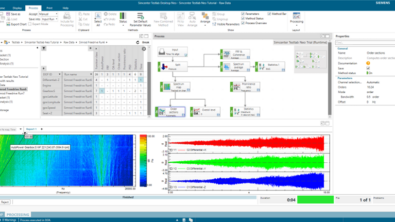
In a follow-up blogpost, the recorded data will be examined using the preview display and the pivot table in more detail. Furthermore, a processing workflow will be created using the Process Designer – the ideal tool for processing and handling the multiphysics data. Finally, while using the reporting function of Simcenter Testlab Neo, we’ll show you how to automatically generate reports and autofill the plots with data. Stay tuned!
If you want to learn more about our signature testing in Simcenter Testlab Neo, take a look at this blog post.