Until we have a magic cream against battery aging, simulation software will do the trick!
Aging affects most things on earth – except Tom Cruise of course – and batteries are no exception from that phenomenon. Batteries are “living” things, species flow back and forth between 2 electrodes, there are chemical reactions and even mechanical changes, such as a “breathing” effect (expansion and contraction of electrodes due to intercalation and de-intercalation of Lithium during charge/discharge cycles). Simply they are being operated, which creates wear and tear naturally.

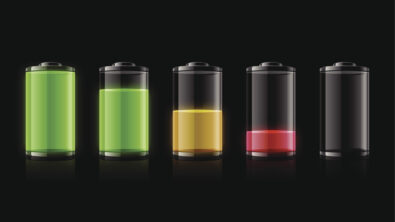
You can’t stop aging: EV fleets will grow older (and with them their batteries)
However, when people are considering ownership of an electric car, the number one criterion for them is range, then price and charging logistics (infrastructure and charging time). Battery life? Only comes at the 6th position. As of today, this may not surprisingly ranked low, considering most electric vehicles are bought brand-new and aging seems a rather technical topic with a large variety of potential battery life evolutions depending on one’s EV usage.
But as EV fleets will grow older (and with them their batteries), second-hand markets start to grow, and suddenly for good reselling prices, battery life and health will surely rise in their (anticipated) importance. Likewise, recycling battery cells that have reached their end of life is still a very cost and energy intense exercise.
And so ultimately, longer lasting, thereby more sustainable battery cells, already are a competitive factor for those designing and selling electric vehicles and battery packs. Therefore, the time is now for OEMs and battery manufacturers to understand battery aging and come up with cell designs for maximum lifespan.
The toxic ingredients to battery cell aging
So, what triggers and affects aging? Batteries aging takes its root causes in several factors. First of all, not a surprise, time: Whether the cell is being used or whether it stays idle, time is at work to let some internal side chemical reaction induce some performance degradation. Second is temperature: Temperature has a significant impact on the process of battery life degradation. High temperature storage and usage (high band of the safe temperature limits) would accelerate aging. Low temperatures are better, but combined with fast charge and it is recipes for other degradation effects. This leads to the third main criterion, the current applied to the cell. Basically, referring to what type of load is applied to the battery. If it is used gently with smooth and low power demands, the current applied to the cell will be gentle and will only slowly affect the aging. However, if the battery is used more aggressively, with more frequent fast charging, particularly in low temperatures conditions, then accelerated degradation mode is on.
A deeper look into battery cell degradation mechanisms
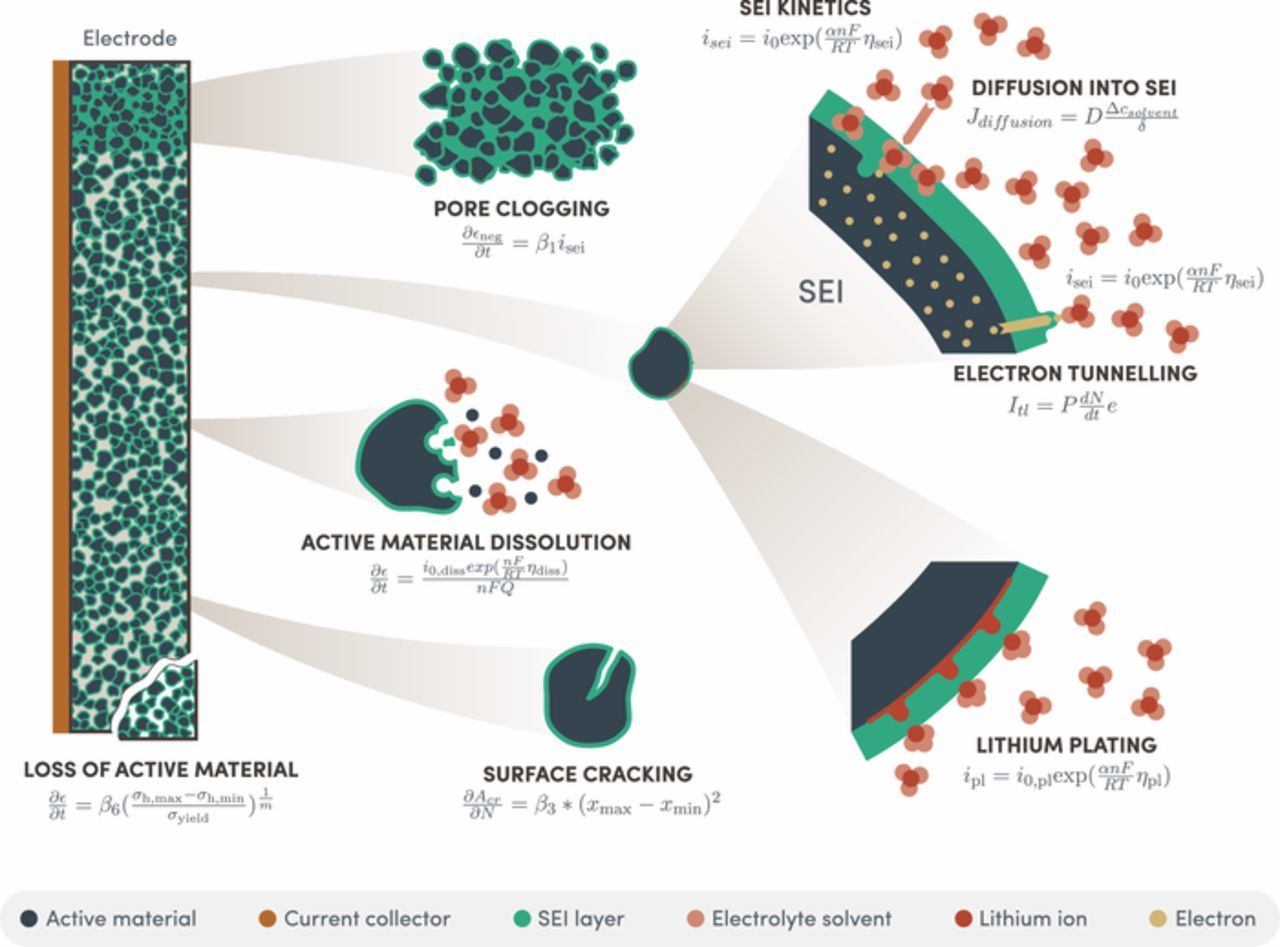
What happens within the battery due to these effects is a combination of several degradation mechanisms:
- Solid Electrolyte Interface film growth: This is the slow growth of a thin, porous layer on the surface of the active material, which consumes Lithium atoms to grow. As it grows the inventory of available lithium, used for the cell operation, decreases, reducing the cell’s capacity. Also, the thickness of the SEI film creates a barrier to the Lithium ions and electrons trying to go in and out of the active material, which increases the cells’ overall electrical resistance
- Lithium plating. In this case, there is formation of lithium metal film on the surface of the active material, which also consumes the lithium inventory impacting the cell capacity.
- Loss of active material by dissolution: Active material responsible for storing lithium is dissolved into the electrolyte due to some undesired side reaction. The loss of this active materials further decreases the cell capacity.
- Loss of active material by mechanical cracking. The Lithium intercalation and de-intercalation process generates at each cycle some mechanical stress. Overtime parts of the active material can break down and be separated from the main electrode. This has the effect of losing ability to store lithium and further decreases the cell capacity.
The bottom-line consequences of these effects are simple, your battery’s capacity will decrease, reducing your vehicle range compared to its brand-new range. And it will be less able to sustain aggressive power demands, reaching more rapidly the lower and maximum voltage safety limits, leading to the battery’s shut down.
Aging takes time – that engineers don’t have
This is why batteries and vehicle makers spend efforts and time to characterize these aging phenomena. But here’s a challenge, the effect of aging are to be seen after several years of operation. So, as you can understand, conducting tests to capture the right degradation behavior takes a tremendous amount of time and money to exercise the battery over years of operation!
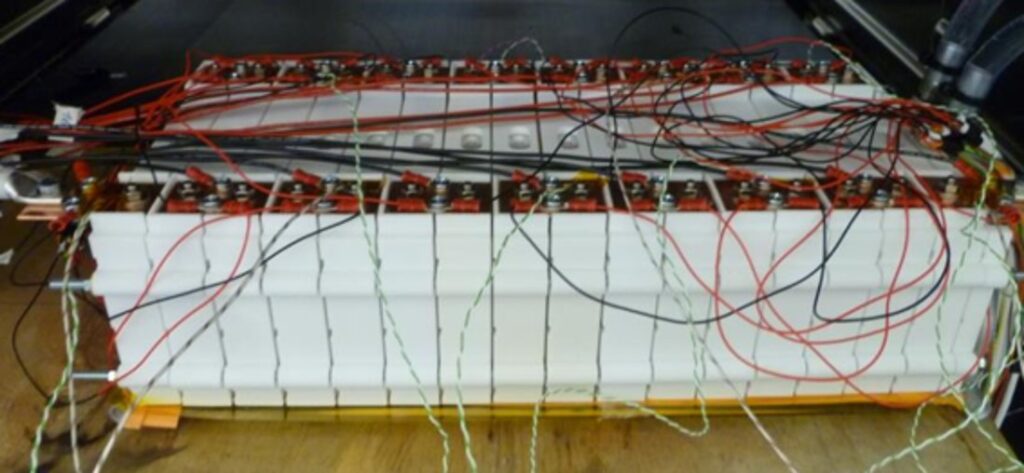
Of course there are some aging acceleration tests techniques, still the earliest results are to be seen after at least 6 month of accelerated aging tests.
Engineers must understand not just when but also where the aging mechanisms occur
Using simulation with aging models can help significantly accelerating the prediction of the degradation trend of a given battery. Typically, 1D level simulations are leveraged in this case, as they allow for a very fast execution and can produce years of simulated data in a few hours.
But to gain a competitive edge, engineers looking into these aging challenges need more details, they need to further optimize the battery cells and understand not just when but also where the aging mechanisms occur, so they can better address the degradation problems locally.
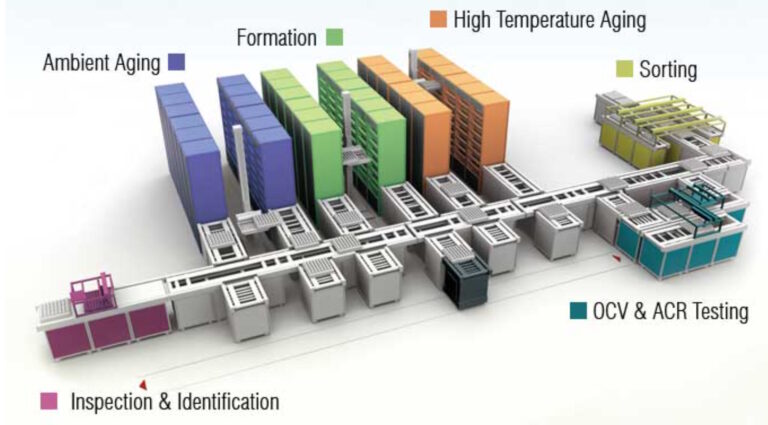
And not only must aging be studied during operation: Equally relevant is the first charge process, known as formation, which is the critical final manufacturing step before cells are shipped. It builds the crucial Solid Electrolyte Interface protective layer and hence has a huge impact on the subsequent lifetime of the battery.
Battery aging simulation
There are several approaches in leveraging simulation to predict aging and formation process.
Firstly, our Simcenter Amesim systems solution, using 1D model can be extremely efficient in generating very rapidly years of aging simulation data under various operating conditions. The main advantage here is time acceleration. Physics-based aging models in Simcenter Amesim will be available in the 2410 release, in addition to the existing empirical aging models.
Secondly, to address the need for spatial information, Simcenter STAR-CCM+ 3D Cell Design solution, can predict aging evolution on a 3D cell geometry with resolved electrode layers. Of course, in this case running time is much longer than with the 1D simulations, but the user will access to local information about where the aging happens and be able to mitigate those effects by changing the design or the operating conditions.
Thirdly, it is then possible to combine both the 1D and 3D simulations. The 1D simulation is used to generate the very long aging simulation of years of physical time. Users could then extract from this discrete point of SOH (State Of Health) of the cell along the aging period, for example every year. This SOH at every year can then be a starting point for a 3D simulation, where the cell is only aged for a short period, for example 1 month physical time, but sufficiently long to generate distribution of the various aging mechanisms, such as SEI growth or Lithium plating as implemented in our latest Simcenter STAR-CCM+ version. Of course, the 1D and 3D aging models are coupled to thermal models to capture the thermal effect on the degradation mechanisms evolution.
Finally, 3D simulations could be leveraged to help in the prediction of the initial Solid Electrolyte Interphase (SEI) layer during the manufacturing formation process. Indeed, the SEI growth model can be used in the first ever battery cell charge and predict the growth of that critical protective layer. The 3D Cell Design capability can then help the user evaluate the uniform evolution of the SEI layer growth and determine the optimal point when the layer is sufficiently thick and how much lithium it consumed to generate it. This will help further refine the estimation of the cyclable capacity.
High fidelity battery aging simulation with Simcenter STAR-CCM+
Aging through parasitic side reactions with Sub-grid Particle Surface Film model
Available since the Simcenter STAR-CCM+ 2406 release, the “Sub-grid Particle Surface Film” model in Battery Cell Designer enables you to simulate the cell response to a duty cycle regarding two of the main degradation mechanisms
- The film growth of the Solid Electrolyte Interphase also abbreviated in the industry to “SEI.”
- The film growth of lithium metal plating
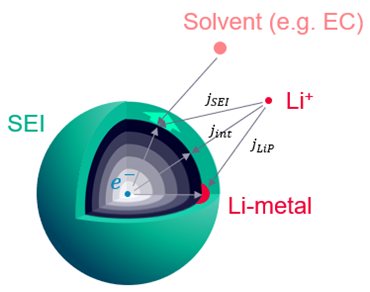
These are both parasitic side reactions which occur during the cell operation. Lithium plating is the deposition of Li-metal on the particle surface. And SEI is the film created from the reaction between the particle and the electrolyte.
Due to the side reactions, the amount of cyclable lithium reduces, you can simply track the remaining lithium in the electrolyte and the active material. This should allow to check the effect on the capacity. The film resistance area (resistivity times thickness) is also a field function which can be tracked and contributes to the overall internal cell resistance.
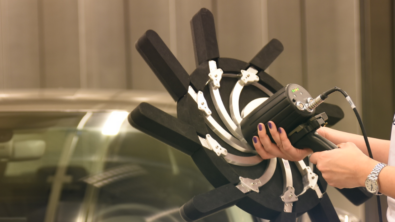
Left: An Active Material Particle, presented at NordBatt Conference
Mechanical-induced degradation with the Sub-Grid Particle Aging model
With the Simcenter STAR-CCM+ 2410 release we are adding the “Sub-Grid Particle Aging” focuses on degradation effects which are of mechanical effects nature. Here, the loss of active material due to mechanical stresses is characterized by the alternating stresses during charge and discharge, that is the cyclic insertion and extraction of lithium from the active material particles, which eventually can lead to cracks forming within electrodes. This can cause loss of electrical contact, and a reduction of the usable active material, leading to an overall cell capacity loss and internal resistance increase.
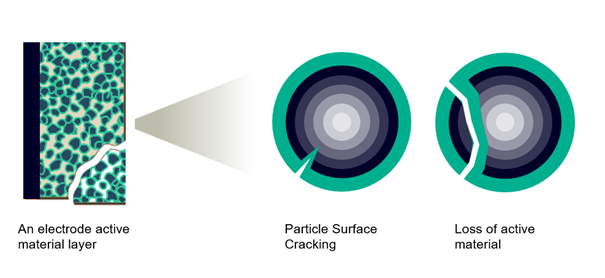
There are two types of cracks forming, represented with two model options under the “Sub-grid Particle Aging” model:
- First one is the “Loss of Active Material” model. It is characterized by the cracking of particles or electrode “blocks”, leading to an electrical contact loss of active material particles, making those particles electrochemically inert and no longer participating in the electrochemical reactions. These particles represent therefore a loss in cell’s capacity
- The second effect is the “Surface Crack Growth” model. The cyclic insertion and extraction generate cracks within the particles themselves. Those cracks expose a new surface for the Solid Electrolyte Interface (SEI) to grow, leading to Lithium consumption and therefore an overall capacity loss and internal resistance increase.
Note that this model option is compatible with the “Sub-grid Particle Surface Film” model enabling the SEI growth effects simulation.
Also note that, some publications on the topic suggest, that the tortuosity should increase when the surface cracks grow.
A trustworthy battery aging simulation framework
The abovementioned aging models were validated against experimental measurements generated during the EU commission funded project MODALIS2, which was focusing on developing physics-based aging models for the latest generation of Li-ion battery cells. This work was performed with key industrial partners specialists in the field of batteries, such as a cell maker, cathode supplier and electrolyte supplier.
All that said, thanks to high physical modeling fidelity and the unique three-dimensional implementation of the models, these aging models offer you the ability to localize areas of the cell which most impacted by all types of aging. This is in theory. So let’s look at those models in action.
Simulating aging cycles in 3D
Our first example was presented at the NordBatt conference in 2022 by my colleague Stefan Herberich. We are using a prototype cell used in the EU funded project MODALIS2 and the cell is tested over several cycles with aggressive aging conditions to locate the weak areas where degradation is the most dominant.
The considered cell consists of 15 electrochemical layers. The discretized cell is shown below along with some results. In total, there are roughly 200,000 finite volume cells. In particular, the thickness direction is discretized using 10 cells per anode and cathode layer and 2 cells for the separator and current collectors.
This is the drive cycle: First, we charge with constant current – this is what the CC stands for. We charge at 2C. To briefly explain what C-rates mean: At 1C, an empty battery – 0% state of charge, abbreviated with SOC – is fully charged in 1h. At 2C the current is twice as high, and the battery would be charged in 30 mins. However, if the voltage exceeds 4.2 V then we switch to constant voltage charging and continue at 4.2 V until we reach 95% state of charge. In the plot on the right, we can see that we reach the 4.2 V limit rather quickly. Next, we rest for slightly more than 3 minutes and then we discharge until 60% state of charge at a rate of 2C. Then we rest again. Overall, this cycle is repeated 10 times.
Results interpretations
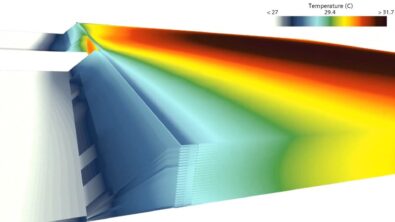
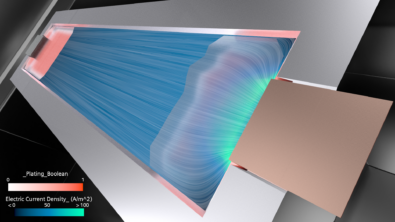
The study gives insights into the effects of the two different aging mechanisms occuring: SEI growth and the influence of the Lithium plating side reactions. The images show the average thickness of the SEI layer around the particle and the equivalent average thickness of plated lithium at a particle, respectively. We look at the corresponding results in the anode plane and in a cross section in thickness direction of the cell.
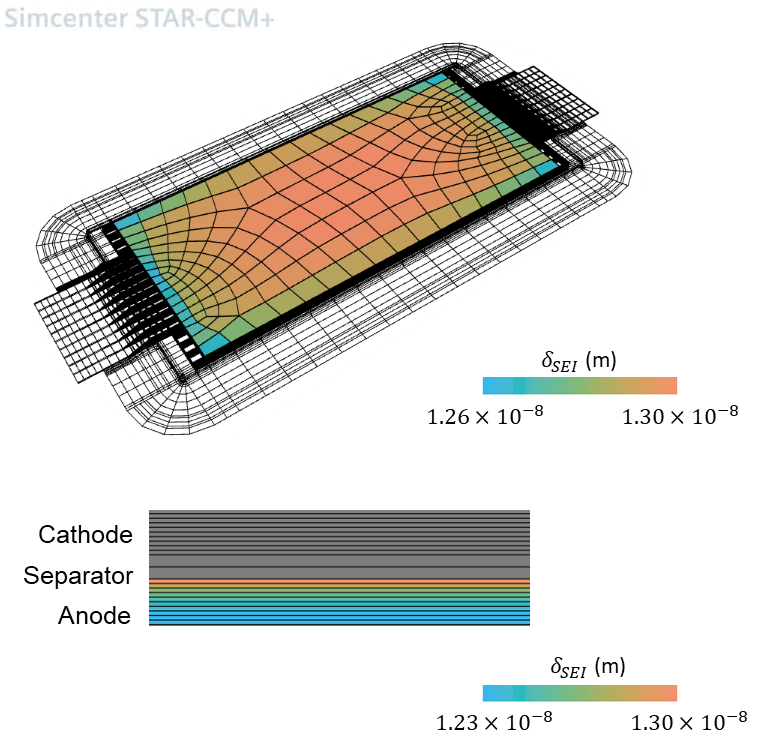
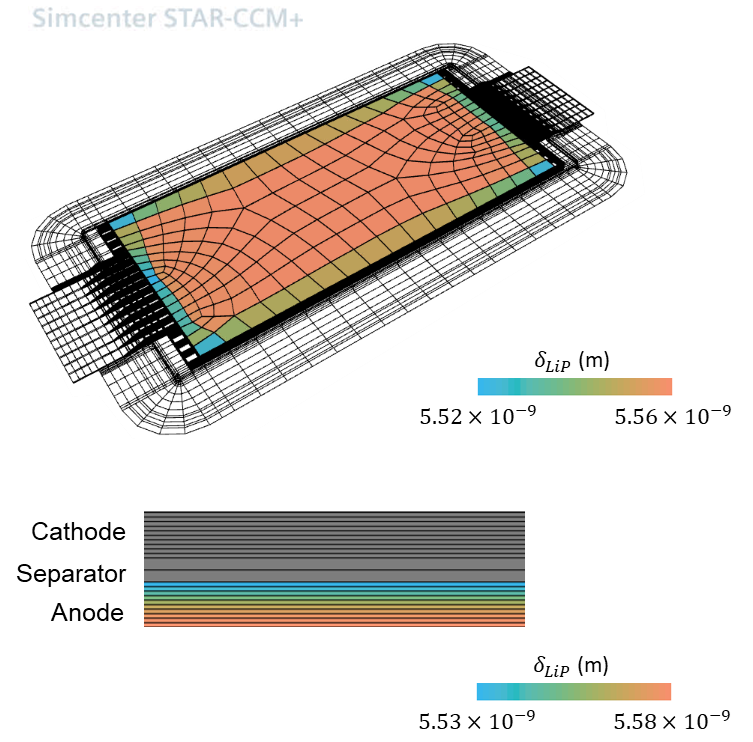
In-plane The thermal boundary conditions are such that the highest temperatures are observed at the center of the battery cell. There, the temperature dependency of multiple material parameters leads to increased SEI growth rates. LAM is pronounced close to the battery tabs, where the highest stress change rates are observed.
In-thickness As expected, SEI growth and LAM are highest near the separator. The operation conditions are such that the Li-metal, with initially specified homogeneous profile, is dissolved faster than it is deposited, especially close to the separator.
SEI during the formation step
Our second study will be on SEI during the initial charge aka formation. Using the results presented in “Andrew Weng et al 2023 J. Electrochem. Soc. 170 090523”, Simcenter STAR-CCM+ and the “Sub-grid Surface Film” model were used to replicate this study. The paper describes the SEI formation, i.e. the build-up of a passivation layer at the graphite anode of a battery during the first load cycles.
The film layer forms due to a side reaction of solvent components S, ethylene carbonate (EC) and vinyl carbonate (VC), with Li+ that produces the film components P, lithium ethylene di-carbonate (LEDC) and lithium vinyl di-carbonate, and gaseous by-products Q.
Only the first 4 hours of the formation process have been simulated , this is when the fast dynamics and the change from the kinetically limited regime to diffusion-limited reaction regime occurs.
The results match with the reference quite reasonably
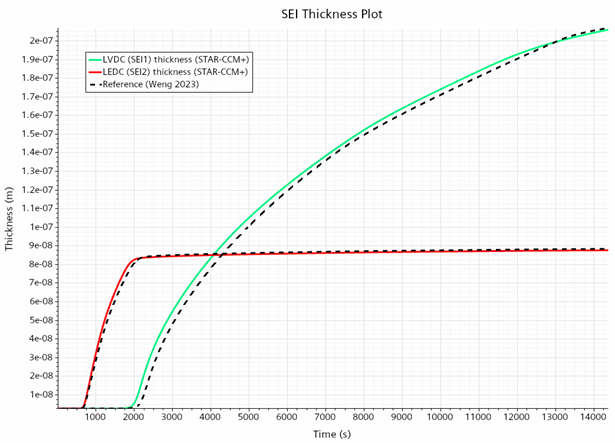
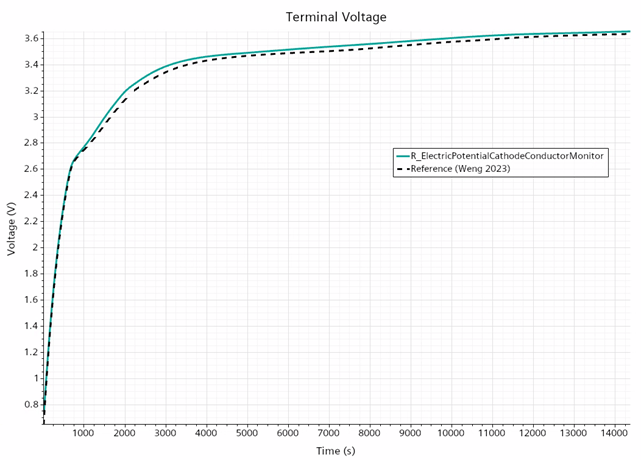
The results demonstrate the ability to use Simcenter STAR-CCM+ in an approach to understand the SEI formation process but also to be able to better control it and brings the potential to reduce its overall duration which in some cases could last as long as ~20 days.
Simcenter STAR-CCM+ helps you develop long-lasting battery cells to support a sustainable future
At the 2023 Lyon International Batteries Event, Prof. Dahn explained in his keynote presentation that developing a lithium-ion battery cell which can last for decades is the way forward for a sustainable future. With it, less rare earth materials mining would be necessary, and home energy management such as Vehicle-to-Grid would be more feasible and affordable for everyone.
The ability to model the degradation mechanisms affecting the Lithium-ion batteries is crucial to developing long-lasting battery cells to support this sustainable future vision. Simcenter STAR-CCM+ 2410 is releasing 4 physics-based aging mechanisms to support cell designers in improving their product performance and maximizing their life expectancy. The integration into a 3D computational domain provides a unique opportunity in visualizing the local impact of aging and the ability for cell designers to act on the design and operating conditions to mitigate these degradation effects.