NX | Tips and Tricks | Performance Predictor

Our latest NX™ software Tips and Tricks video dives into a full end-to-end workflow on how we can use Performance Predictor to quickly analyze and review our models given specific constraints and loads. This an excellent tool to experiment with forces to view your design performance in regard to stress and displacement.
Take a look below to watch the latest video or scroll down to read about NX Performance Predictor in more detail.
What is NX Performance Predictor?
NX Performance Predictor is a fast simulation application that allows you to evaluate and immediately review the design performance of a part in the NX design environment to reduce the number of design iterations. This helps designers make informed decisions, explore concepts without physical prototypes and enhance quality from the start, providing a cutting-edge solution accessible to all users.
Getting started
To begin, select “New Analysis” from the top of the Performance Predictor tab. This lets us perform a preliminary inspection to determine if our part meets certain specifications. First, choose the analysis type and then name the new analysis. You can choose to perform Linear Statics tests, Thermal analysis or Natural Frequency analysis. In this latest Tips and Tricks episode, we dive specifically into a Structural analysis of our part.
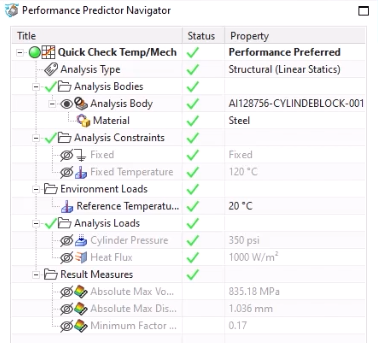
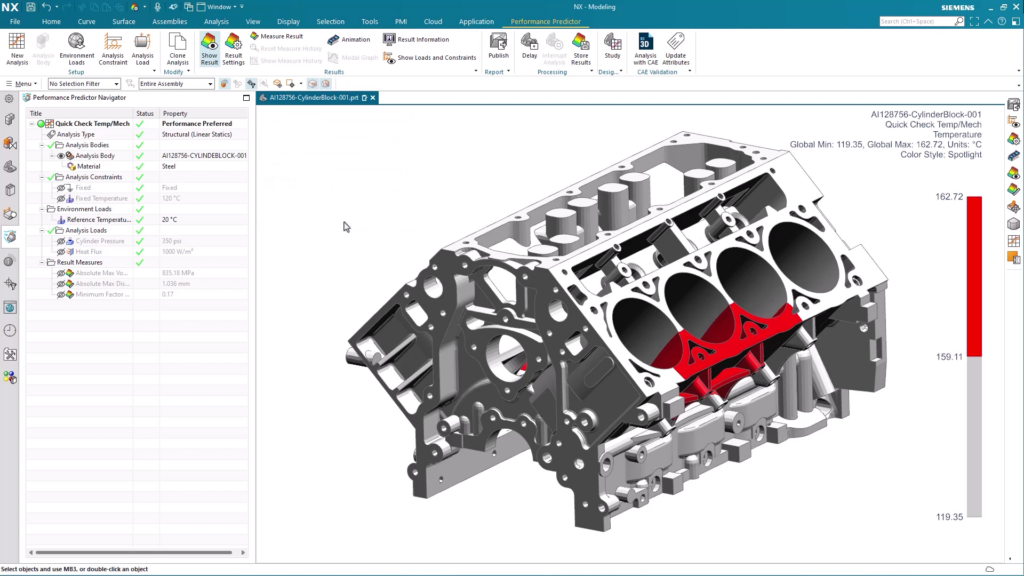
One key component of performing a new analysis using Performance Predictor is understanding how the Performance Predictor Navigator is organized. At the top of each analysis, we see the name we selected at the beginning of the process. We can also view our analysis type, along with any bodies, constraints and loads selected for the tests. The last section of this navigator displays the results found in the predictor.
The navigator makes it easy to pick up tests from others and quickly understand all their key components. Additionally, we can quickly edit or delete any unnecessary constraints and loads in the existing analysis tests as needed.
Applying loads and constraints
Before we can apply our loads and constraints, the next step is identifying our analysis body. When we work with a single part, NX will automatically define the analysis body as the existing part. However, in contexts such as assemblies and sub-assemblies, we must choose which part to assess and analyze.
Once we finish that, we can begin applying the loads and constraints we want to test. These are broken up into three primary categories: Analysis Constraints, Analysis Loads and Environmental Loads. Let’s dive deeper into each category’s purpose.
Analysis Constraints: Use this command to constrain the faces of the analysis body in the active analysis. Available constraints include Fixed, Pinned, Pinned Slider, Linear Slider, Planar Slider, and Fixed Temperature.
Analysis Load: Use this command to apply loads to the bodies in your linear statics analysis. The loads you apply should represent the real-world conditions the model needs to withstand in your assembly. Specifically, you can apply loads including Force, Bearing Load, Pressure, Torque, Acceleration, Remote Force and Heat Flux.
Environmental Load: Use this command to apply global constants, such as the magnitude of gravity in a specified vector or the ambient temperature, in your analyses.
When creating tests, it’s best to simulate realistic conditions. This applies to both the constraints we set and the loads we apply. Using values that align with real-world conditions will yield the most valuable results.
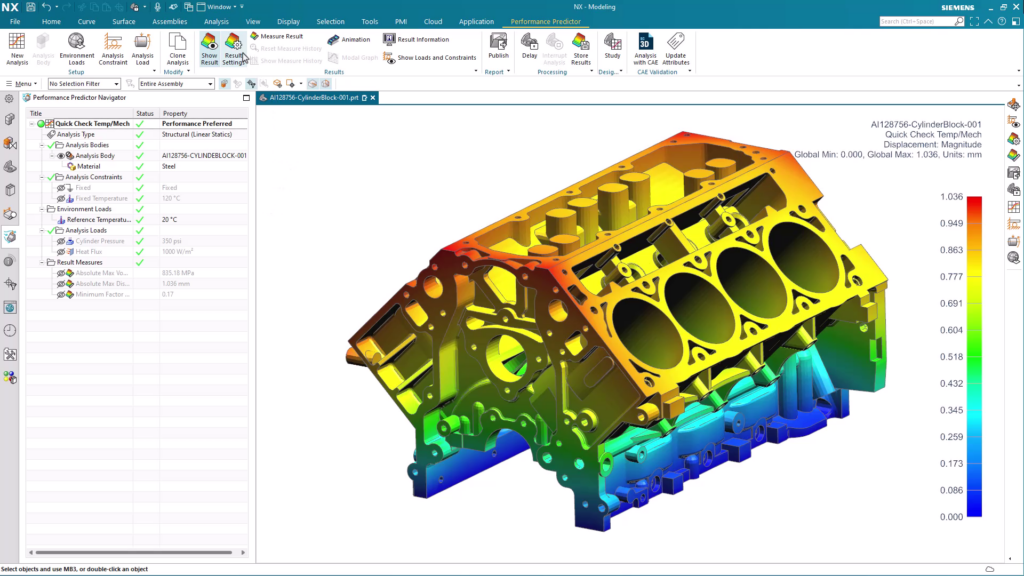
Viewing results
After you define an analysis, NX displays the results in the Graphics Window. This produces a color map display of the results based on the settings used in your analysis. If you need to change the value shown in the color map display, you can update the model by modifying the result settings.
Additionally, there are two drop-down boxes in the result settings window to control the color map display contour and color styles. This makes it easy to map your results in a manner that suits your needs.
Publishing analysis reports
Another useful trick for organizing your results in Performance Predictor is to publish an analysis report. After you complete an analysis of your part, use the Publish command to create a report. This command uses templates that you can customize with tags to generate reports of the results. The templates are saved as .docx files.
Your customized report can include:
- Units
- Part descriptions
- Analysis body descriptions
- Material descriptions
- Loads and constraints
- Result viewports
- Result measures
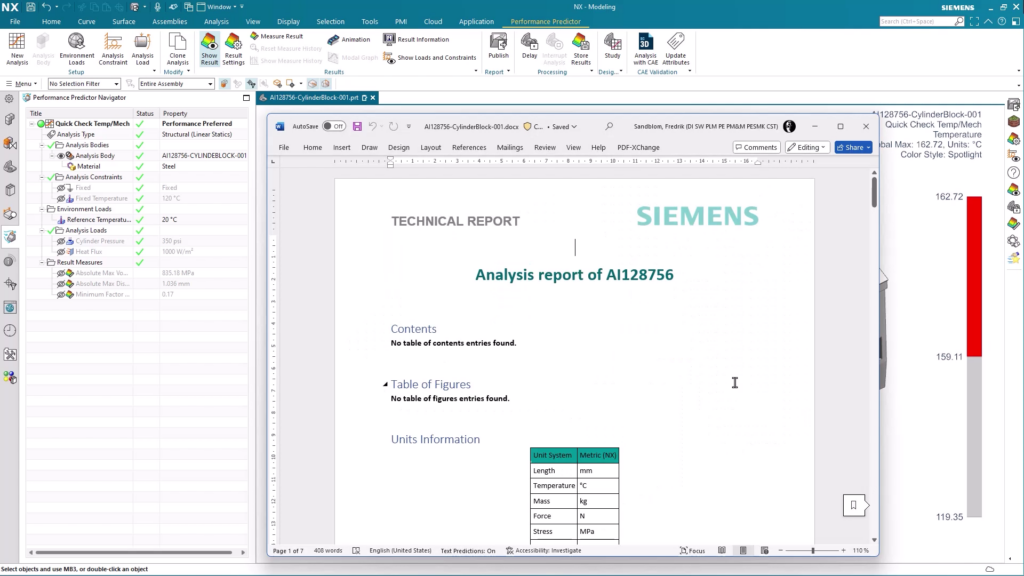
Using the analysis report can save valuable time recording test results, making it easy to move from one step of the design process to the next.
Continue your journey with NX
Watch the Sketch Navigator Tips and Tricks video here ▶️
Watch the Select Similar Faces Tips and Tricks video here ▶️
Take me to the NX design blog 📚