NX Render Blog Series: The visualization process for Consumer Products
Introduction
The world is in the midst of a digital revolution. We’re moving into an era where the process of visualizing the digital twin for any CAD dataset is becoming integral to a company’s competitiveness. Individuals, prospects, customers and companies all expect an efficient visualization pipeline. The result? A range of high quality renders that can be used across a variety of use cases. Any sector from heavy machinery through to consumer products can truly benefit from an effective visualization pipeline.
A reluctance to recognize this exposes companies to losing their competitive advantage. This could reduce their market share and plunge them into obscurity. The question is, what does the typical visualization workflow look like?
The visualization process for consumer products
Any visualization process include a range of activities to take complex datasets through to stunning renders. We’ve already completed one series, focusing on the JCB Fastrac 8250. Click the following link to find more information on series one:
Our second series will focus on the same five steps needed to achieve a stunning high-quality render within consumer products. We will guide you from start to finish by our in-house visualization expert Gavin McCambridge. Gavin has more than 20 years in the visualization industry and knows the importance of composition to create stunning images within NX Render. Gavin will be discussing his typical approach to a new project, whilst offering expert tips and tricks to efficiently achieve high-quality results.
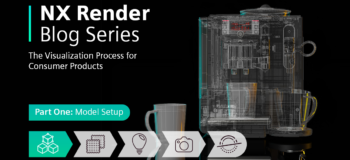
The model in question – Bosch Coffee Machine
Throughout this series, we will be diving into the world of consumer products. Series two will be focusing on a Bosch Coffee Machine. Our first series explored a model within the heavy machinery industry. The JCB Fastrac model had a large dataset, as well as being quite literally a massive model. For this series, we’ve chosen the Bosch Coffee Machine as the model to focus on due to its complexities and intricacies. We’ll compare this with the sheer size and scale of the JCB Fastrac to see how this could affect the visualization workflow. What is Gavin looking for whilst preparing the data?
“For the Bosch Coffee Machine, I’m really becoming familiar with the intricacies of the Coffee Machine; there is an element of this for any model, but I don’t need to think about scale for this dataset. Once I’ve grasped the internal mechanisms it’s a fairly straightforward model to work with.“
Checking the model for completeness
Becoming familiar with a model is the important first step in any typical visualization workflow, irrespective of the type of model. Taking this step gives you an indication of the multiple parts available to you, and how this compares to the real-world model. It can’t be under-stated how critical this step is for the rest of your visualization process. How do visualization experts like Gavin research their real-world model?
TOP TIP
“Once I feel confident that I can work with the model, I’ll go onto Google. What I’m aiming to do here is check the real life product. For the coffee machine, I’m looking at the internal piping, the wiring and the touchpad. I want to get a real understanding of the model I’m working with. Because of this, it’s so important to really understand every detail for the model. It’ll make it a lot easier later on in the workflow.“

Becoming familiar with the model
These initial steps need to be done during the early stages of the visualization process to see the model in its entirety. In addition, it’s a common occurrence for parts of a model to be hidden or fully suppressed on first viewing. As a result, not being aware of this could impact on the quality of the final render later in the workflow, especially with an intricate model like the Bosch Coffee Machine. Thankfully, there’s a simple step that can be done to address this.
TOP TIP:
What you want to do is look through your model tree for anything that’s either turned off, not loaded or suppressed. Go down your model tree and turn everything back on so you can see EVERY part for the model. It just gives you a better idea of the model you’re working with”
The power of suppression to optimize your workflow
The importance of utilizing model suppression, both in terms of hiding and un-hiding geometry cannot be ignored. Un-hiding geometry gives you an understanding of the complete model you’re working with. It’s a crucial step to possibly revealing any duplicate geometry for different variants.
Multiple variants for the same model part can be visible at the same time, clashing issues within the dataset. When you also consider parts of a model you don’t need purely from a visualization perspective, you’re able to suppress or completely remove a large amount of data for your final render. As a result, the final render won’t be compromised, but the dataset is significantly reduced. In addition, you’ll speed up your workflow and reduce the overall time to final render.
We asked Gavin to see which parts were hidden to reduce the dataset without compromising on render quality:
“Those initial steps are so important for the rest of the workflow. They give you a much better understanding of the dataset you’re working with. I’ll make sure I’ve got visibility for everything when I’m working on a new model, but what I tend to do is turn off parts that I know won’t be seen in the final render. These can normally be smaller parts, such as small bolts or well-hidden wiring. I’m already thinking about camera placement at this stage which is another way of identifying parts I know I don’t need.”
Creating the VBOM for your model
There’s a neat trick visualization experts use to turn off parts that aren’t visually important to the final render. Experts can create a visual bill of materials, or more commonly known as a VBOM. A VBOM allows any expert to manage a portfolio of visualization specific elements such as scenery or part variants separately to the core of the Engineering Bill of Materials, or EBOM. Taking this approach allows you to keep the visualization elements separate from the EBOM, which is focused more on the engineering and manufacturing side of the model.
Summary
Making sense of any new dataset you’re working on before configuring it for visualization is essential, especially for a complex model like the Bosch Coffee Machine. It’s important to remember that forgetting key setup steps can significantly affect the quality of your final render, whilst simultaneously increasing your time to render. Doing these initial steps eliminates any issues occurring as you move through the visualization process, which we’ll start to explore in the next entry.
Keep an eye out for part two, where we’ll be taking a look at material application within NX Render.