P&R Designers—Want to quickly analyze and debug signoff DRC errors in P&R?
By Srinivas Velivala – Mentor, A Siemens Business
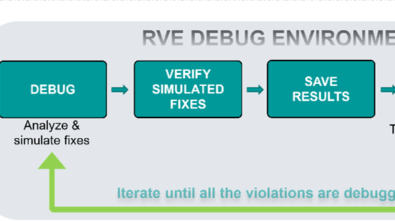
Want a better, faster way to debug signoff DRC errors in P&R? How about syncing multiple design environment displays, so you can see GDS data right next to the layout? The Calibre RVE interface makes it possible. Keep reading, then watch and learn…

During DRC debug, P&R designers frequently see top-level DRC errors that interact with top-level objects and objects in IP placements. However, without the ability to see the detailed IP GDS, the designer doesn’t have the polygon information needed to identify the root cause. Opening the GDS separately to analyze the error is time-consuming and just plain annoying.
The Calibre® RVE™ interface can make this problem disappear by syncing multiple design environment displays. The Calibre RVE multi-viewer capability can create socket connections between editors such as the Calibre DESIGNrev™ interface, and the Cadence® Innovus™, Cadence Encounter®, Synopsys® IC Compiler™, and Synopsys IC Compiler II tools. For example, using the multi-viewer function, designers can open the full GDS design data in the Calibre DESIGNrev interface and drive dual navigation in both tools from the Calibre RVE environment. Now designers can quickly get the information they need to identify the cause of the error, and understand and apply the proper fix.
Want to see how it works? Watch our Calibre How-To video, How to simultaneously debug and fix DRCs with Calibre RVE Multi-viewer highlights. We walk you through the process and show you just how easy it is to start using the multi-viewer function. You’ll be on your way to faster DRC debug in no time!