Part 8: The 2018 Wilson Research Group Functional Verification Study
IC/ASIC Resource Trends
This blog is a continuation of a series of blogs related to the 2018 Wilson Research Group Functional Verification Study. In my previous blog, I presented trends related to various aspects of design to illustrate growing design complexity. In this blog, I plan to discuss the growing IC/ASIC project resource trends resulting from growing design complexity.
Percentage of Project Time Spent in Verification
Figure 8-1 shows the percentage of total IC/ASIC project time spent in verification. As you would expect, the results are all over the spectrum; whereas, some projects spend less time in verification, other projects spend more. The average total project time spent in verification in 2018 was 53 percent, which did not change significantly between 2012 through 2018. This is remarkable considering that designs have grown in terms of size and complexity, yet the overall percentage of project time spent on verification has relatively remained constant.
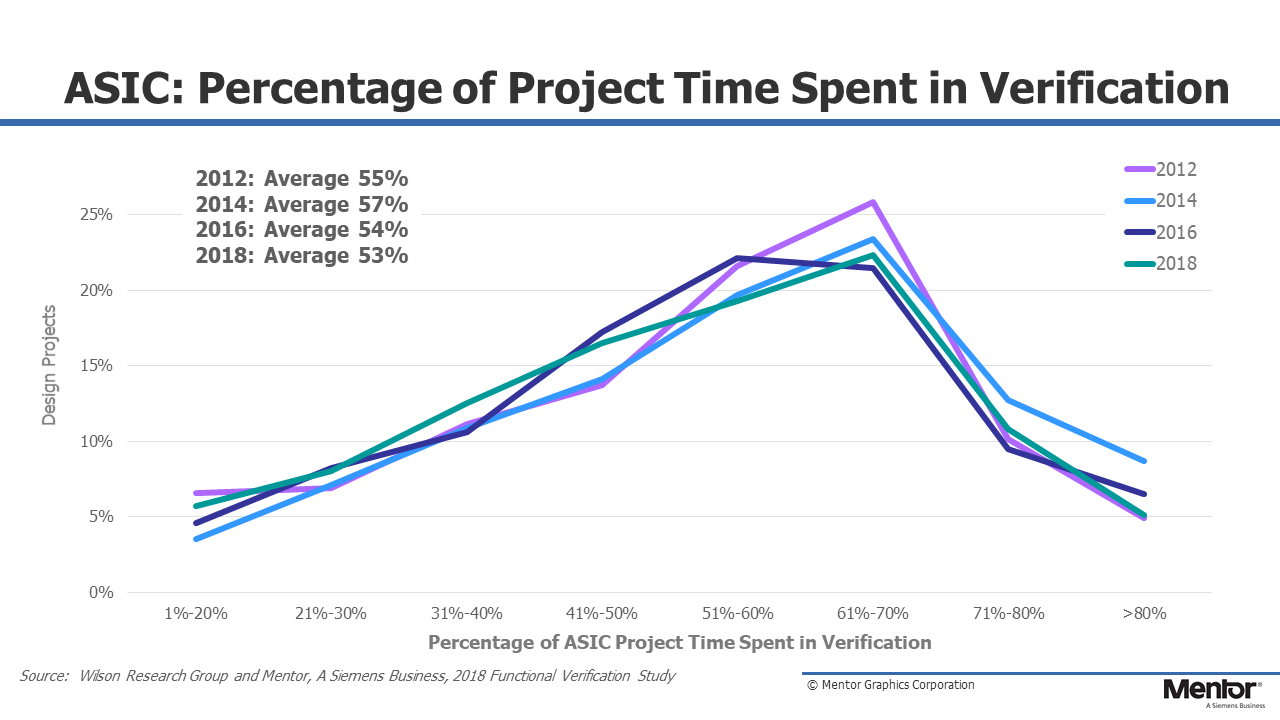
Figure 8-1. Percentage of IC/ASIC Project Time Spent in Verification
Mean Peak Number of Engineers
Perhaps one of the biggest challenges in design and verification today is identifying solutions to increase productivity and control engineering headcount. To illustrate the need for productivity improvement, we discuss the trend in terms of increasing engineering headcount. Figure 8-2 shows the mean peak number of engineers working a projects between 2007 and 2018. Again, this is an industry average since some projects have many engineers while other projects have few with differing ratios. You can see that the mean peak number of verification engineers today is just slightly greater than the mean peak number of design engineers. In other words, there are, on average, more verification engineers working on a project than design engineers. This situation has changed significantly since 2007.
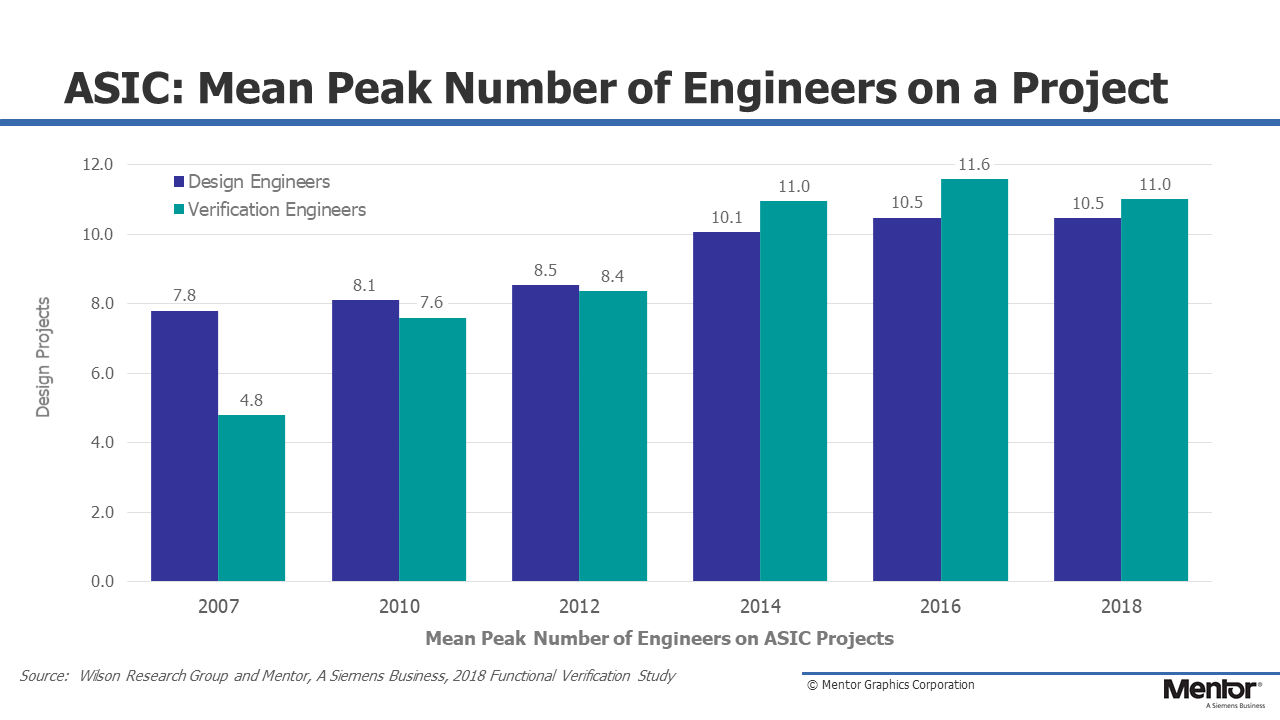
Figure 8-2. Mean Number of Peak Engineers per IC/ASIC Project
Another way to comprehend the impact of today’s project headcount trends is to calculate the compounded annual growth rate (CAGR) for both design and verification engineers working on projects. Between 2007 and 2014 the industry experienced a 3.8 percent CAGR for design engineers and an impressive 12.6 percent CAGR for verification engineers. Clearly, the double-digit increase in required verification engineers during this period was a major project cost management concern, and is one indicator that the industry under scoped the verification effort during this period. To address growing verification complexity the industry was forced to mature its verification processes. Today, we find that the demand for verification engineers has flattened out between 2014 and 2018. Essentially we have reached a one-to-one ratio in terms of mean peak number of design and verification engineers.
Where Design Engineers Spend Their Time
But verification engineers are not the only project stakeholders involved in the verification process. Design engineers spend a significant amount of their time in verification too, as shown in Figure 8-3. In 2014, design engineers spent on average 47 percent of their time involved in design activities and 53 percent of their time in verification. While in 2018 we found that design engineers spent on average 54 percent of their time involved in design activities and 46 percent of their time in verification.
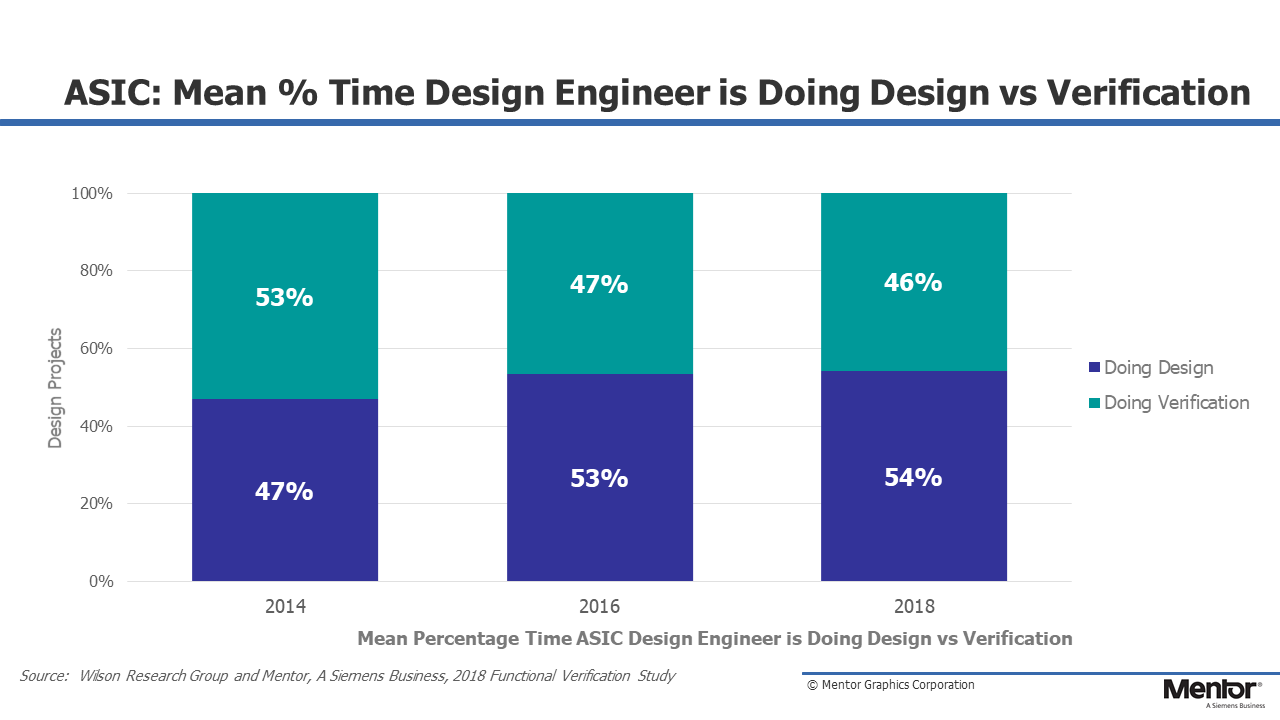
Figure 8-3. Where IC/ASIC Design Engineers Spend Their Time
One factor contributing to the increased percentage of time a design engineer spends in design activities is the growing number of design requirements, as illustrated in Figure 8-4.

Figure 8-4. New Layers of Requirements Driving Complexity
Where Verification Engineers Spend Their Time
Figure 8-5 shows where verification engineers spend their time (on average). Our study found that verification engineers spend more of their time in debugging than any other activity. In fact, we found that the time spent in debugging grew significantly between 2016 (39%) and 2018 (44%). From a management perspective, this can be a significant challenge when planning future projects’ effort and schedule based on previous projects’ data since debugging is unpredictable and varies significantly between projects.
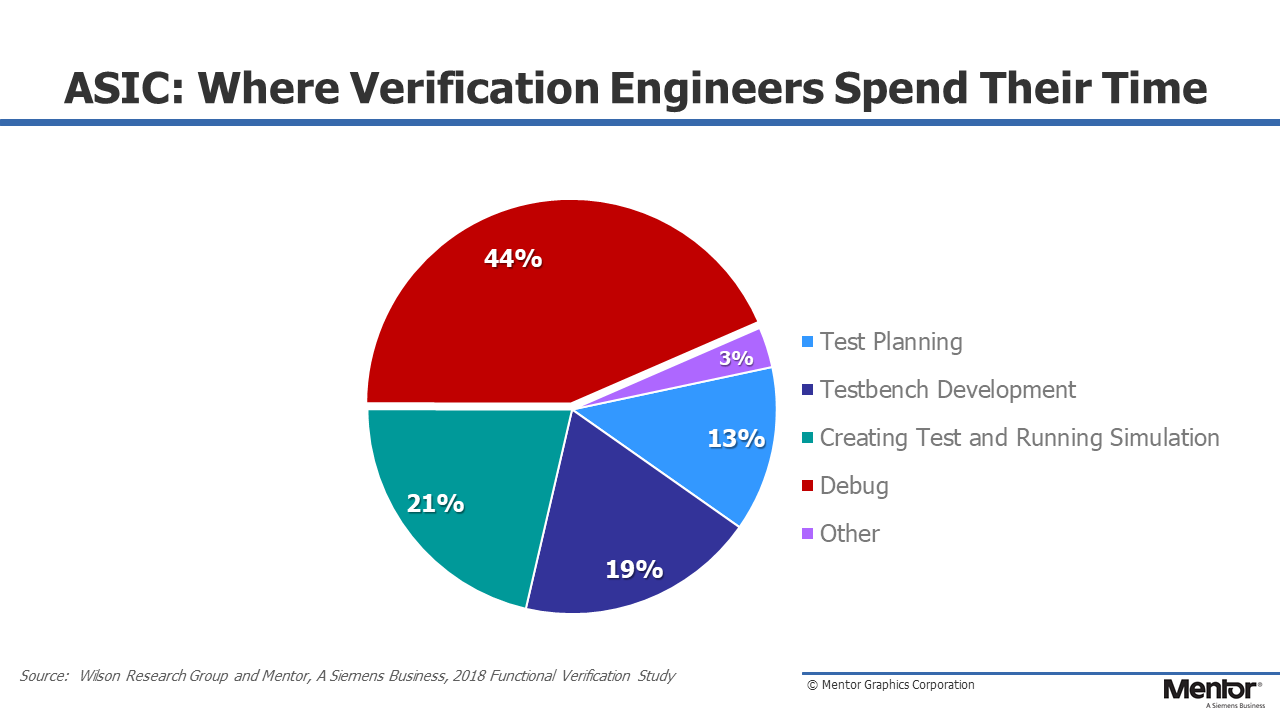
Figure 8-5. Where IC/ASIC Verification Engineers Spend Their Time
In my next blog, I plan to discuss various IC/ASIC verification technology adoption trends.
Quick links to the 2018 Wilson Research Group Study results
- Prologue: The 2018 Wilson Research Group Functional Verification Study
- Understanding and Minimizing Study Bias (2018 Study)
- Part 1 – FPGA Design Trends
- Part 2 – FPGA Verification Effectiveness Trends
- Part 3 – FPGA Verification Effort Trends
- Part 4 – FPGA Verification Effort Trends (Continued)
- Part 5 – FPGA Verification Technology Adoption Trends
- Part 6 – FPGA Verification Language and Library Adoption Trends
- Part 7 – IC/ASIC Design Trends
- Part 8 – IC/ASIC Resource Trends
- Part 9 – IC/ASIC Verification Technology Adoption Trends
- Part 10 – IC/ASIC Language and Library Adoption Trends
- Part 11 – IC/ASIC Power Management Trends
- Part 12 – IC/ASIC Verification Results Trends
- Conclusion: The 2018 Wilson Research Group Functional

Comments
Comments are closed.