Part 4: The 2014 Wilson Research Group Functional Verification Study
FPGA Verification Effectiveness Trends
This blog is a continuation of a series of blogs related to the 2014 Wilson Research Group Functional Verification Study (click here). In my previous blog (click here), I focused on the amount of effort spent in FPGA verification. We have seen in previous blogs that a significant amount of effort is being applied to FPGA functional verification. In this blog I focus on the effectiveness of verification in terms of FPGA project schedule and bug escapes.
FPGA Schedules
Figure 1 presents the design completion time compared to the project’s original schedule. What was a surprise in the 2014 findings is that we saw an improvement in the number of FPGA projects meeting schedule—compared to 2012. It is unclear why we are seeing this trend now. Perhaps managers are getting better at scheduling—or are becoming more pessimistic with their schedules. Or, perhaps it is due to the increase amount of reuse (both design and verification IP). Or, is the increased amount of FPGA verification effort prior to “getting to the lab” starting to pay off for some projects? This data point raises some interesting questions worth exploring further. Regardless, still a significant number of FPGA projects miss their originally planned schedule.
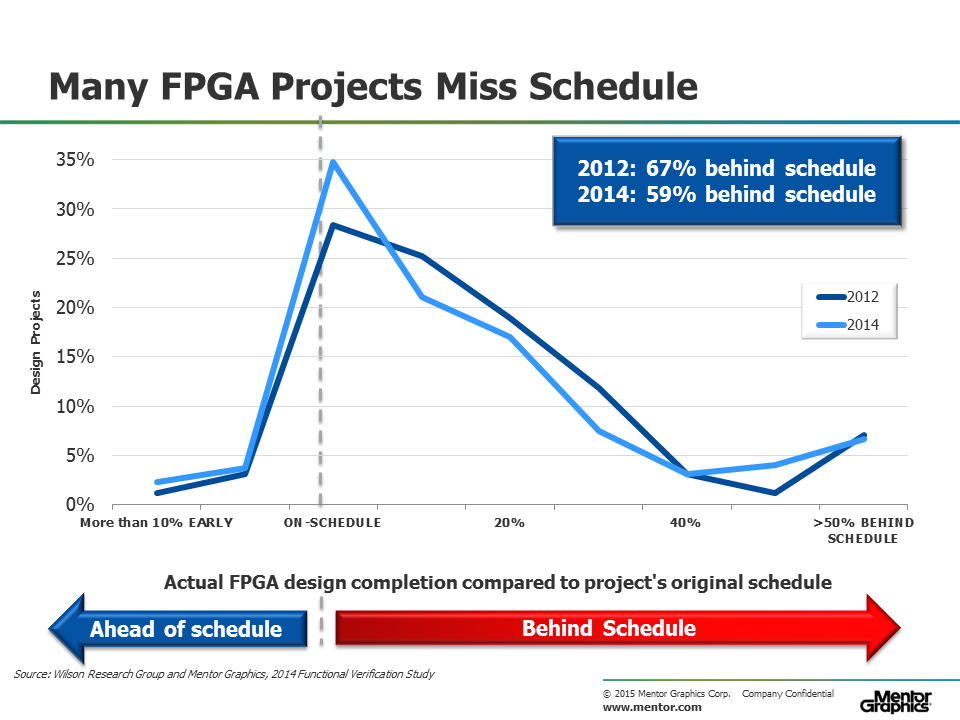
Figure 1. FPGA design completion time compared to the project’s original schedule
FPGA Lab Iterations
ASIC/IC projects track the number of required spins that occur prior to market production. In fact, this can be a useful metric for determining the overall verification effectiveness of an ASIC/IC project. Unfortunately, we lack such a metric for FPGA projects. For the 2014 study, we decided to ask the question related to the average number of lab iterations required before the design went into production. Again, this was done to try and get a sense of the project’s verification effectiveness. The results are shown in Figure 2. However, I’m not convinced that FPGA lab iterations is analogous to ASIC/IC respin as a verification effectiveness metric. Perhaps a better metric for future studies would be the number of bugs that escape into production and are found in the field. This might be something we should consider on future studies.
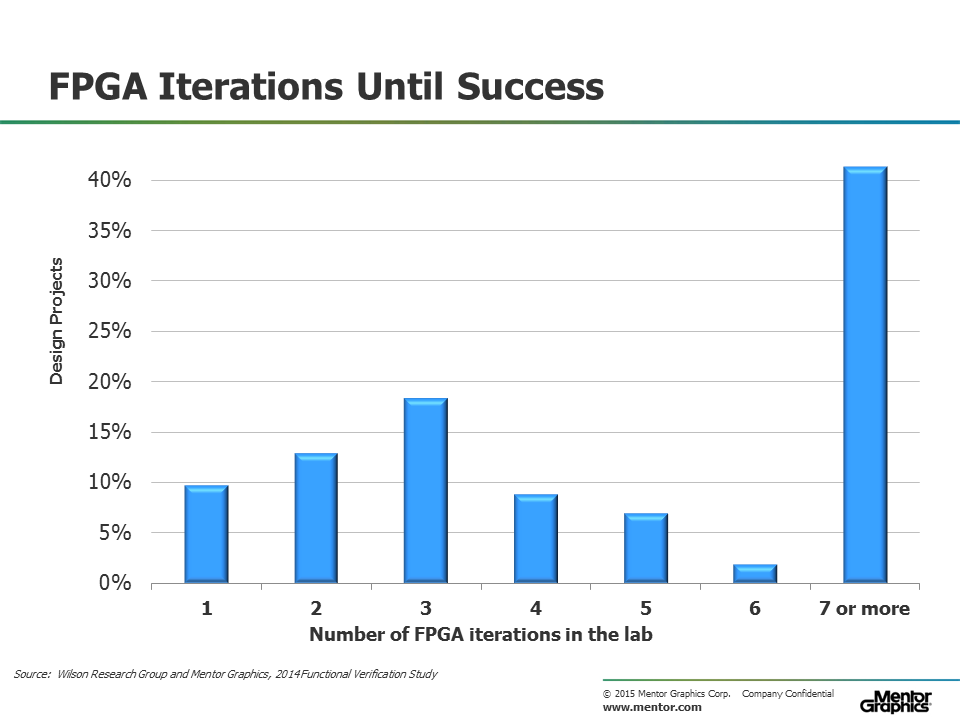
Figure 2. Number of FPGA iterations in the lab (no trend data available)
FPGA Bug classification
For the 2014 study, we asked the FPGA project participants to identify the type of flaws that were contributing to rework in the lab. In Figure 3, I show the two leading causes of rework, which are logical and functional bugs, as well as clocking bugs. The data seems to suggest that these issues are growing. Perhaps due to the design of larger and more complex FPGAs. Again, this is a data point worth exploring further.

Figure 3. Types of Flaws Resulting in FPGA Rework
In Figure 4, I show trends in terms of main contributing factors leading to logic and functional flaws—and you can see that design errors are the main cause of functional flaws. But note that a significant amount of flaws are related to some aspect of the specification—such as changes in the specification—or incorrect or incomplete specifications. Problems associated with the specification process are a common theme I often hear when visiting FPGA customers.
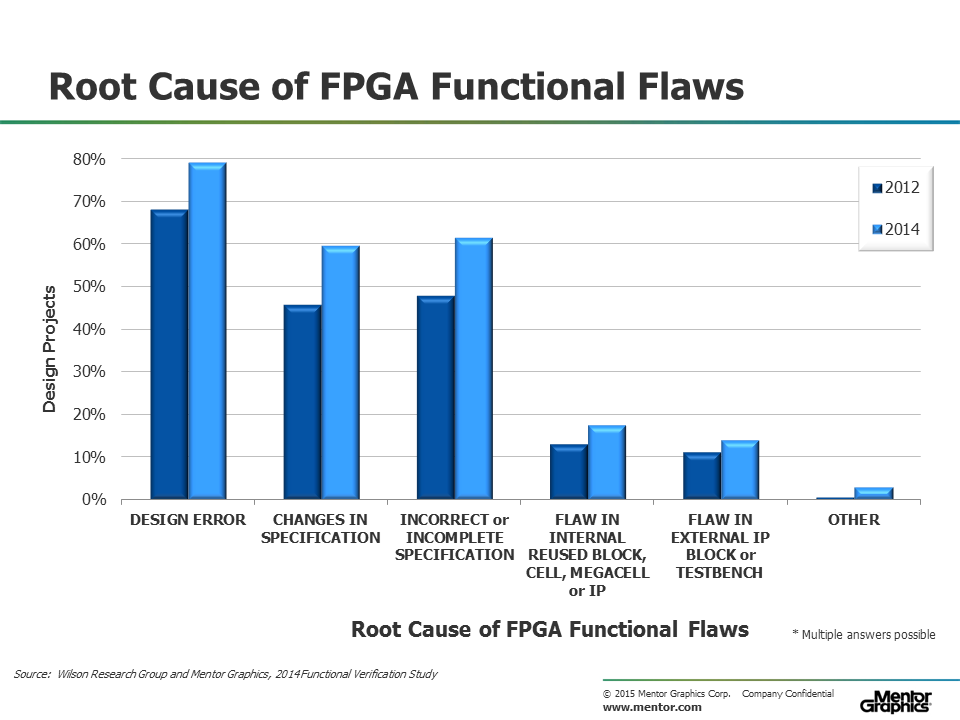
Figure 5. Root cause of FPGA functional flaws
In my next blog (click here), I plan to presenting the findings from our study for FPGA verification technology adoption trends.
Quick links to the 2014 Wilson Research Group Study results
- Prologue: The 2014 Wilson Research Group Functional Verification Study
- Understanding and Minimizing Study Bias
- Part 1 – FPGA Design Trends
- Part 2 – FPGA Verification Effort Trends
- Part 3 – FPGA Verification Effort Trends (Continued)
- Part 4 – FPGA Verification Effectiveness Trends
- Part 5 – FPGA Verification Technology Adoption Trends
- Part 6 – FPGA Verification Language and Library Adoption Trends
- Part 7 – ASIC/IC Design Trends
- Part 8 – ASIC/IC Resource Trends
- Part 9 – ASIC/IC Verification Technology Adoption Trends
- Part 10 – ASIC/IC Language and Library Adoption Trends
- Part 11 – ASIC/IC Power Management Trends
- Part 12 – ASIC/IC Verification Results Trends
- Conclusion: The 2014 Wilson Research Group Functional Verification Study


Comments