Part 12: The 2012 Wilson Research Group Functional Verification Study
Schedules, respins, and bug classification
This blog is a continuation of a series of blogs that present the highlights from the 2012 Wilson Research Group Functional Verification Study.
In my previous blog, I focused on some of the 2012 Wilson Research Group findings related to formal verification, acceleration/emulation, and FPGA prototyping trends. In this blog, I present verification results findings in terms of schedules, respins, and classification of functional bugs.
We have seen in previous blogs that a significant amount of effort is being applied to functional verification. An important question the various studies have tried to answer is whether this increasing effort is paying off.
Schedules
Figure 1 presents the design completion time compared to the project’s original schedule. What is interesting is that we really have not seen a change in this trend in over five years. That is, 67 percent of all projects are behind schedule with respect to the original plan. One could argue that designs have increased in complexity in terms of gate counts, embedded processors, and lots of software between 2007 and 2012. Yet, achieving project schedules has not worsened.
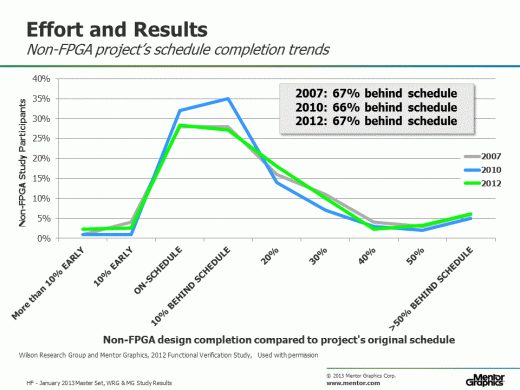 Figure 1. Non-FPGA design completion time compared to the project’s original schedule
What’s interesting is that the FPGA designs follows this same trend, as shown in figure 2.
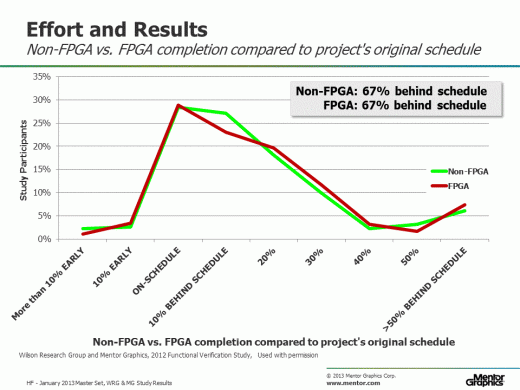 Figure 2. Non-FPGA vs. FPGA design completion time relative to the original plan
Respins
Other verification data points worth looking at relate to the number of spins required between the start of a project and final production. Figure 3 shows this industry trend all the way back to the 2004 Collett study. Again, even though designs have increased in complexity, the data suggest that projects are not getting any worse in terms of the number of spins before production. If anything, there appears to be a slight improvement recently in this trend in projects requiring three or more spins.
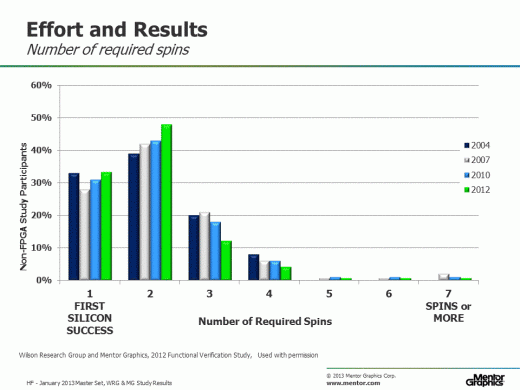 Figure 3. Number of spins required from start of project until production
Bug classification
Figure 4 shows various categories of flaws that are contributing to respins. Note that the sum is greater than 100% on this graph, which is because a respin can be triggered by multiple flaws.
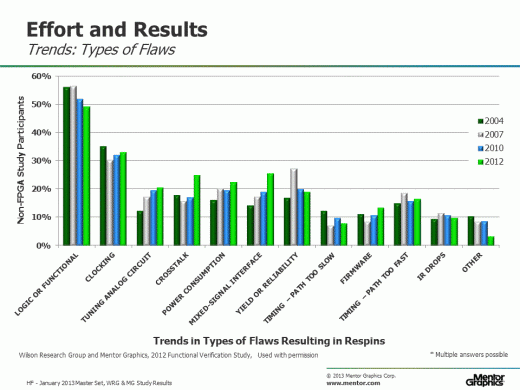 Figure 4. Number of spins required from start of project until production
Although logic and functional flaws remain the leading causes of respins, the data suggest that there has been some improvement in this area over the past eight years. Is this due to the increased amount of reuse that is occurring in the industry? Or is the industry maturing its verification processes? Or is something entirely different going on? This data point raises some interesting questions worth exploring.
Figure 5 examines root cause of functional bugs by various categories. The data suggest an improvement in logic errors over an eleven year period, and potentially, a worsening of problems related to changing specifications. Problems associated with changing, incorrect, and incomplete specifications is a common theme I often hear when visiting customers.
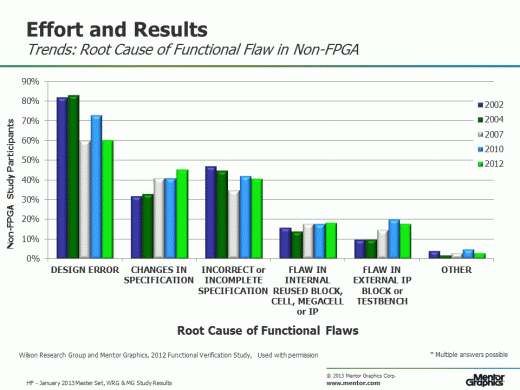 Figure 5. Root cause of functional flaws
In my next blog, I plan to wrap up this series of blogs in what I call the Epilogue—which will discuss potential gotchas and cautions on interpreting certain aspects of the data and thoughts about how the data might be used constructively.


Comments