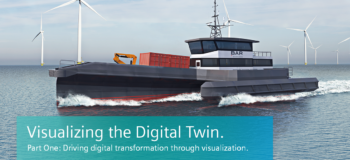
Driving digital transformation through visualization
The phrase “A picture is worth a thousand words” is generally attributed to a newspaper editor, Arthur Brisbane, who first used it in a 1911 article about journalism. At the time, photography was relatively new, and Brisbane was conveying the notion that images (i.e. visualization) make it easy to communicate complex subjects compared to text. It was true then and it remains true today. Visualization across the product life-cycle is extremely beneficial because it increases clarity and understanding of complex products and processes. It leads to faster decision making and increases productivity. Siemens Digital Industries Software is a leader in product life-cycle visualization technology and applications.
So, visualization is important and even more so if you consider the findings of some studies that suggest the human brain can process images 60,000 times faster than text. It’s not surprising then that visualization is a leading trend driving digital transformation across all domains. Through a new series of blog posts by one of our Vis leaders Dave Hutchinson, we’ll shine a light on how visualization is being used to support the Digital Twin through the entire life-cycle across a range of industries, both traditional and cutting edge.
Dave recently joined the Siemens NX product management team through the acquisition of computer graphics software specialists Lightwork Design where he was Director of Technology and Operations. He has worked on visualization topics since university and held roles spanning software development, sales, product management and executive leadership.
Understanding the Digital Twin:
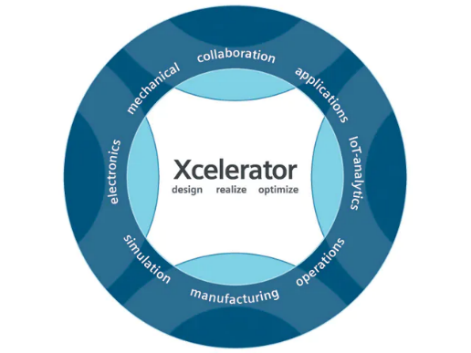
The Siemens Xcelerator portfolio turns complexity into a competitor advantage, enabling a Comprehensive Digital Twin covering the entire product and production lifecycle, including a closed-loop to ensure actual performance data feeds back into continuously refining models. It scales to microelectronics, mechanical design, software, simulation, manufacturing, virtual commissioning, app development and IoT analytics. In this way the comprehensive digital twin links all your engineering teams.
So, when we talk about Visualizing the Digital Twin, we can think in this way:
The Comprehensive Digital Twin displays the right visualization at the right time by adapting to any role, task or platform along the life-cycle. The ability to visualize the digital twin with high fidelity is available across The Siemens’ Xcelerator portfolio, increasing clarity, improving collaboration and enabling rapid comprehension of complicated products and processes.
The right visualization at the right time: Communication is key when it comes to the value of visualization, we are trying to communicate complex ideas or data in a way that improves our understanding or enables, through collaboration, an improvement in our group understanding.
High fidelity visualization: You may read this as being a very realistic visualization, but we are talking about the clarity, suitability and overall presentation of information. Such that ideas and information are conveyed in a clear, unambiguous and useful way.
Clearly this is a huge topic that we will dig into, but to get us started let’s highlight how visualizing the digital twin through the Siemens Xcelerator portfolio is being deployed by BAR Technologies.
Working with BAR Technologies
BAR Technologies have a broad knowledge of naval architecture, simulation, CFD and patented IP. They were challenged to deploy this specialized skill set into the development of a superior Crew Transfer Vessel for taking technicians to work on Wind Turbines (amongst other uses). The aim being to improve sea-keeping and help make a green energy sector even greener by dramatically reducing fuel requirements.
The result is a craft that is truly novel, reduces vertical accelerations by between 35% and 70% and is between 30% and 50% more fuel efficient. Here are just three of the areas where different styles of visualization were used to drive different parts of the design journey.
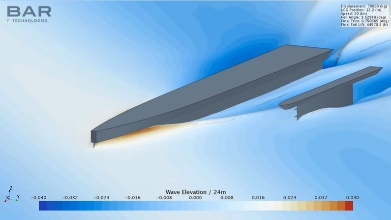
Simulation with STARCCM+
As showcased in the recent ‘over the sea’ webinar with BAR Technologies, simulation was used extensively throughout the development process, almost entirely replacing physical testing in water tanks. This video and the images here clearly show how visualizing the simulation results gives context and confidence to engineers and stakeholders that the results are going to deliver.
Immersive exploration using NX Virtual Reality
NX VR is integrated directly into NX, enabling you to experience the Digital Twin of your design at full scale. With large models such as this crew transport vessel being able to explore the design collaboratively at human scale providing a unique perspective that can help engineering teams check accessibility, test sight lines and review other critical engineering challenges.
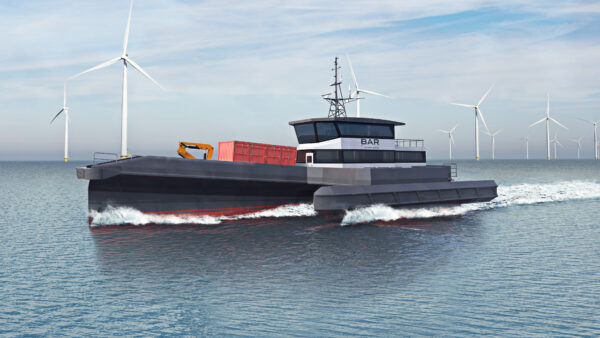
Photoreal example with NX Render
BAR use the integrated NX Render to produce photo-realistic images to help pitch ideas to stakeholders, review design ideas and support marketing. Integrated visualization accelerates workflows by enabling you to work directly in NX with full associativity. This reduces time to first render by up to 30% and time to second render by up to 90% compared with exporting to third party tools.
These are just a few examples of how customers are accelerating their workflows today by capturing and visualizing the most comprehensive digital twin. We look forward to exploring some of these areas in more detail and tying in industry trends and where we will end up next. Look out for the next post in this series where we’ll explore some of the key trends in visualization.
About the author
Dave Hutchinson recently joined the Siemens NX product management team through the acquisition of computer graphics software specialists Lightwork Design where he was Director of Technology and Operations. He holds a PhD in 3D computer graphics, surfacing and animation from the University of Manchester, UK to complement a Master’s degree in computer science and a Bachelor’s degree in physics. He has held a range of previous roles in graphics and visualization across software development, sales, product management and executive leadership.