Experiment vs. Simulation, Part 5: Detailed IC Package Model Calibration Methodology
In the royal family of thermal IC package modelling types, a detailed model is King. All critical 3D geometry is modelled explicitly, no abstraction into a thermal resistor equivalent model, no hiding all the proprietary design information inside either. Pros and cons of detailed models I covered a few years ago in this blog. Packaged ICs are complex, constructed of many parts, with many different material properties. If you’re going to take a detailed modelling approach (rather if you’re lucky enough as an end user to obtain a detailed a model) you’ll be wanting to ensure the model is as accurate as possible. How can you do that without destructively testing a physical equivalent and spending loads on material testing machines and SEM time? Use a T3Ster based experimental testing approach instead!
After 4 years of blogging and a memory that ain’t getting any better, I’m sure to have a tendency to repeat myself. In this instance I know I have. I introduced this detailed model calibration concept a while back. I’ll take this opportunity to go into a bit more technical detail as to how it’s done.
Start with a physical sample and use T3Ster to measure it’s thermal response to a step change in its power dissipation, measure the power off Tj vs. time curve. Then use the T3Master software to convert that into a structure function. A ‘thermal x-ray’ of the package, a graph that shows all the thermal resistances and capacitances the heat experiences as it passes from the die through the package and out.
Next take your equivalent detailed model, either from your supplier or created for you using FloTHERM PACK, FloTHERM’s IC package model creating pre-processor, and simulate it in FloTHERM in the same environment and power change configuration as you’d measured with T3Ster.

 The animations show the simulated thermal response of the insides of the package. In this case a surface mount TO263 with quite a small die size/package body ratio.
The animation on the left shows temperature and heat flux vectors vs. time. The larger animation below shows the heat flux vectors and FloTHERM’s unique ‘Bottleneck’ parameter, indicating exactly where the thermal resistances are that the heat flux experiences as the package heats up.
 Convert the simulated Tj vs. time data (Zth curve) into a structure function and compare with the experimental equivalent. If the numerical model was 100% correct then the 2 Zth curves and 2 structure functions would match perfectly.
If you’re a supplier who knows the internal construction information (you should, you designed it) then this is a fine tuning comparison. If you’re an end user then this is a reverse engineering activity.
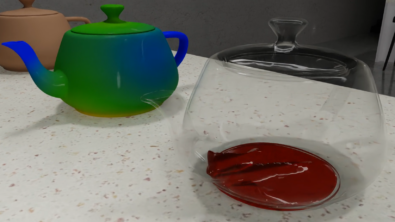
Next step is to use the features (peaks and troughs) in the structure function to determine physically what each one represents. Once that’s done you can construct this type of banding description:
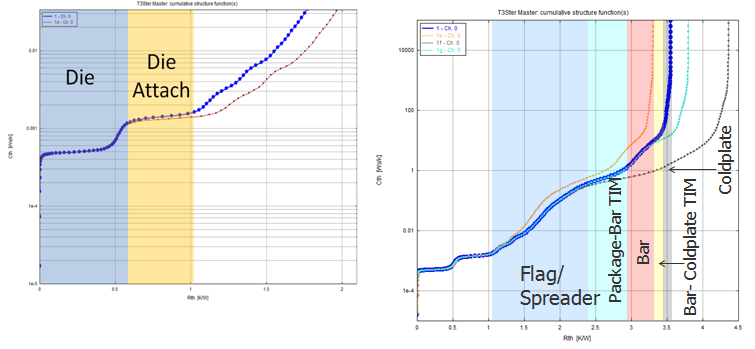
Now that you know what structure function feature represents what, and thus which features are incorrect in the model (where and by how much there is a difference between experimental and simulated structure functions) you can make successive calibration modifications to the detailed model, rerun, re-compare, repeat, until all the numerical model is calibrated. One man’s calibration is another man’s reverse engineer…
Once the model is calibrated you then verify using a Zth comparison.
 The main point to take away from this methodology is that it is the correlation between features in the structure function and physical features in the package that enable pin pointed calibrations to be achieved. Knowing which bit of the X-Ray corresponds to which bone in the (package) body.
Detailed models are indeed King, unrivalled in accuracy and also used to derive simple compact thermal models such as 2R and DELPHI types. You’ve got to have a good detailed model and this methodology enables you to achieve that!
[If you want to know more about the nitty gritty technical details of this example please check out the Semitherm paper myself and colleague Andras Vass-Varnai authored: ” A Detailed IC Package Numerical Model Calibration Methodology” 28th IEEE SEMI-THERM Symposium]
19th April 2013, Ross-on-Wye