Bottlenecks and Interface Materials; Part 2 – When TIMs Go Bad
‘Bits stuck onto other bits’, a succinct definition of an electronic product, if not a product that contains electronics. Soldering is the method of choice for getting the components to attach to the pcb, the layered board that contains the metallic traces connecting component pins to other component pins. Rivets, welds, screws or bolts for the chassis, some form of gluing or sticky adhesion for everything else. Nothing comes for free and the ease by which bits can be stuck to other bits is more than compensated for by the fact that such joins are sometimes unreliable and/or tend to offer a substantial barrier to heat flow, raising temperatures, effecting performance and reliability. There are a ream of TIM vendors out there and each of their sales pitches are as scary and worrying as they are genuinely concerning to those involved in product design and manufacture.
A product that has 100s, if not 1000s of parts offers certain, shall we say, ‘challenges’ when it comes to creating a 3D virtual prototype in a CAE simulation software. Whereas the mainstay of classic CFD simulations involve predicting the air flow over a handful of parts, applying CFD successfully to electronic thermal simulation requires a technology that can handle 100s of parts and 10s of 1000s of solid/solid and solid/fluid interfaces. Something FloTHERM has excelled at for over 22 years now.

With so much cluttered complexity and complex heat flow paths in an electronic product the use of simulation is highly valuable, especially as a tool to enable a designer to become a thermal design expert. I gave up trying to double guess the thermal performance of a system before a simulation was conducted ages ago. I would have thought that for this DVD application, when simulating the effects of a breakdown in the effectiveness of the TIM connecting the TO with the heat spreader I would have seen a nice large thermal bottleneck in the TIM. Some thermal expert I’m not…
 I modelled the failed TIM by simply reducing its thermal conductivity. A more quantified approach (that likely would be done as part of a paid consultancy, not this vocational blog) might have employed T3Ster to measure the TIM thermal resistance itself, to be used as an input to this simulation. The FloTHERM simulation indicates that the junction temperature rise of the TO220 increases by 20% to over 100 degC. The next question should be why? and what can we do (could we have done) about it?
The bottleneck number, invented by us and implemented now in FloTHERM, is a method of indicating not where something is hot, but why. It pin points regions that are responsible for the increase in the temperature of the electronics. It’s simply constructed as well, just the dot product of heat flux (how much heat is flowing) and temperature gradient (how difficult heat finds it to flow) vector properties at any and all points in the simulation. The result is a thermal bottleneck ‘map’. Red is high bottleneck, blue is low.
When the TIM fails the heat, as it rushes through the path of (relatively) least resistance, ends up necking down through the screw that holds the tab of the TO to the heat spreader. Despite the screw being made of nice highly conducting metal (aren’t they all?) there is so much heat, also bending in and out of the screw shaft, that it ends up being the biggest bottleneck in the system.
Should really point out the other bottlenecks in and around the package. The lead that’s fused to the die flag carries some heat through a small cross section. The rest of the bottlenecks can be seen in the die attach and sure, some in the TIM itself.
So what could have been done to mitigate the increase in temperature when the TIM failed. Chose a better (read: more expensive) TIM is the obvious one. Chose a better package is another. Maybe design things so that two TOs were used maybe? Failing those lets look further afield to see where other bottlenecks exist.
‘Iso surfaces’ are useful post processing objects to visualise the distribution of a variable outputted as part of a simulation. They are surfaces at a constant value. Choosing a high bottleneck number and plotting the resulting bottleneck iso-surface we can see more than just what was on the center section plane plots used so far.
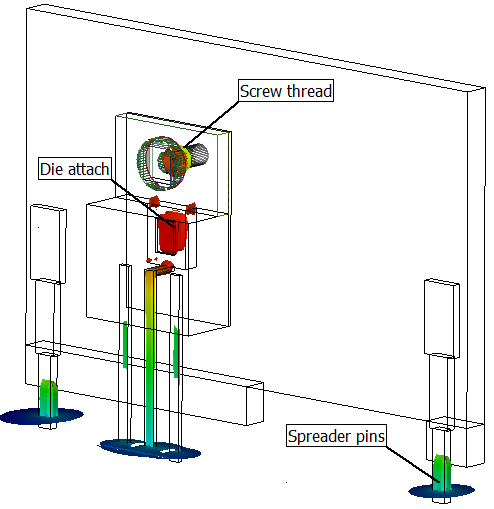
The bottlenecks where the spreader pins connect to the bottom plane of the PCB offer an opportunity to affect the thermal performance through a change in the design. Even when the TIM fails a lot of the heat still makes its way to the spreader. As pointed out in the previous blog, the spreader is no way big enough to transfer all the heat to the air, a lot of it ends up going through its pins into the PCB.

Beyond looking like a lopsided moustache or a pair of pony tails the heat flux lines show the bunching of the heat flow, coloured by bottleneck number, they indicate that surely doing something in that area will have an effect upstream back to the die. Exactly how much affect we’ll see next time.
30th January 2012, Ross-on-Wye