What Type of Measurements Are Possible with Gear Test Rig?: Part 2
Welcome Back to part 2 of Gear Test Rigs! If you have not read part 1 you can do so below:
Part 1: 6 Advanced Methodologies for Gear Test Rig: Part 1
If you have, then read on to learn more about what measurements are possible using gear test rig!
High -precision measurements for lightweight gears, strain gauges, instrumentation, data acquisition
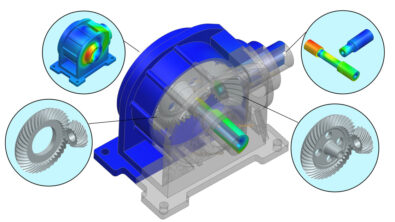
The test rig allows to accurately measure the transmission error (TE) using angle encoders, mounted on both shafts. In addition, the gear pair is instrumented with strain gages on the gear body and in the tooth root. Figure 5 shows a magnified view of the sensors (strain gages) attached in the tooth root area and the corresponding wiring. The signal-to-noise ratio of the measured strain signals has been improved by adopting full Wheatstone bridges. The electric bridges are installed between the sensors and the slip rings.


Figure 5: The lightweight gear is instrumented by tooth root and body strain sensors (left). Some of the Wheatstone bridges are visible in the image. The magnified view of the tooth root sensors (right) shows how the strain gauges are wired to the bridges.
The data acquisition is performed using Simcenter SCADAS frontend, allowing the simultaneous measurement of multiple sensor data at high sampling rates.
Discussion of the experimental results, static condition
The gear Transmission Error (TE) is widely recognized as the main internal source of vibration in power transmissions. It quantifies the deviations from a perfectly kinematic motion transmission which in a real case are introduced by deflections, misalignments and manufacturing errors. In Figure 6, the measured TE is presented for different loading conditions (internal torque values). This figure corresponds to a (quasi-) static configuration, where the rotation speed is constant. A third-order modulation effect, caused by gear stiffness variations in the lightweight gear, can be clearly observed within one revolution in the measured TE.

Figure 6: A solid gear meshes against a lightweight gear with 3 holes. The Transmission Error (TE) is shown in the plot.
Discussion of the experimental results, dynamic condition
In another test, the rotation speed varies linearly, up to 2000 rpm. During this test (known as “Run-up”), the sensor data is acquired and stored with a high sampling rate. The acquired data is processed using the Simcenter Test.lab platform, where time-frequency and order analysis results are produced. Two test scenarios have been considered:
(1) Gear set A, in which a solid gear is meshing with a lightweight gear having a uniform and symmetrical rim geometry; and
(2) Gear set B, in which the rim geometry of the lightweight gear includes 3 holes.
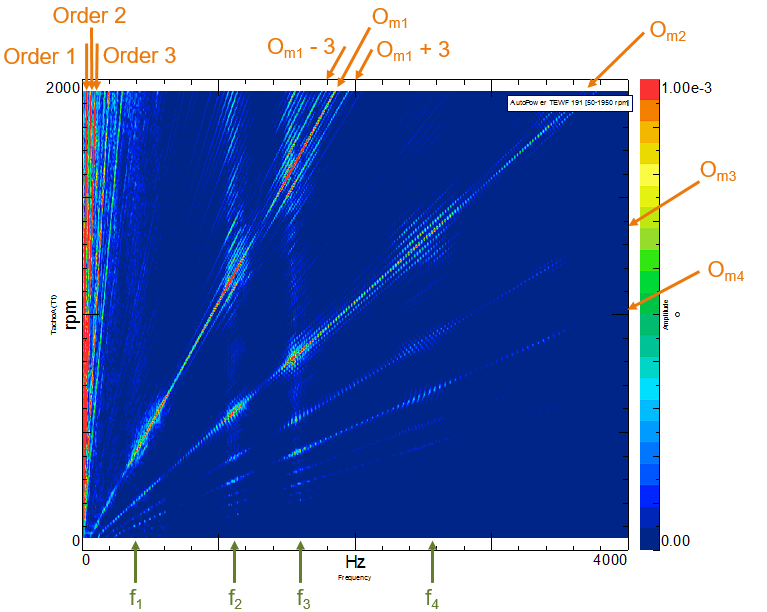
The measured transmission error in both cases have been acquired and the results are presented in Figure 7. As the rotation speed increases, the measured TE shows a different trend in the frequency domain for gear sets A and B.
Figure 7 illustrates the effect of the rim geometry on the measured TE; (1) As expected, the resonances of the system happen at slightly different frequencies since the mass/stiffness of the gear sets is different. (2) Although the principal meshing order (Om1) and its multiples (2 x Om1 , 3 xOm1 , etc.) appear to have the same trend for both gear sets, the corresponding sidebands are not similar. For the gear set A (Figure 7 left), the meshing order is modulated mainly by an order 1, resulting in orders (Om1 +/- 1, etc.). On the other hand, for the gear set B (Figure 7 right), additional sidebands are observed. These sidebands appear mainly as an order 3 modulation (Om1 +/- 3, etc.). The effects of the three holes in the lightweight gear body are also clearly visible in the lower frequency range, where order 3 and its multiples are present.
As mentioned earlier, the modulation effects in gear set B are caused by the stiffness variations in the tooth meshing area. This phenomenon happens mainly three times per revolution. The experimental results show that the presence of holes in the gear body does not produce a pure order 3 variation in TE. As multiples of the order 3 are also involved, the modulation effect is more pronounced and more sidebands are observed.


Figure 7: By comparing the two-color maps, one can observe the effects of stiffness variation by means of modulation of 3. In the low frequency, the multiples of order 3 are visible, whereas the modulation affects the meshing orders by introducing sidebands of +-3.
That wraps up part 2 of Gear Test Rigs! If you have any questions or comments please feel free to reply down below.