This intriguing ship propulsion system will blow your mind
Climate change is a challenge looming over human life and ecosystems. Now, the maritime industry faces new challenges in reducing its carbon footprint. Everyone in this industry must comply with International Maritime Organization (IMO) marine regulations. These regulations are increasingly targeted at drastically reducing carbon emissions. To help the industry design innovative vessels, Siemens, with its Simcenter portfolio, provides tools that will help you meet IMO regulations.
In this post, we will see how Simcenter Amesim can help you assess the gain in terms of fuel consumption and greenhouse gas (GHG) emissions by retrofitting Flettner rotors, or rotor sails, to an existing ship.
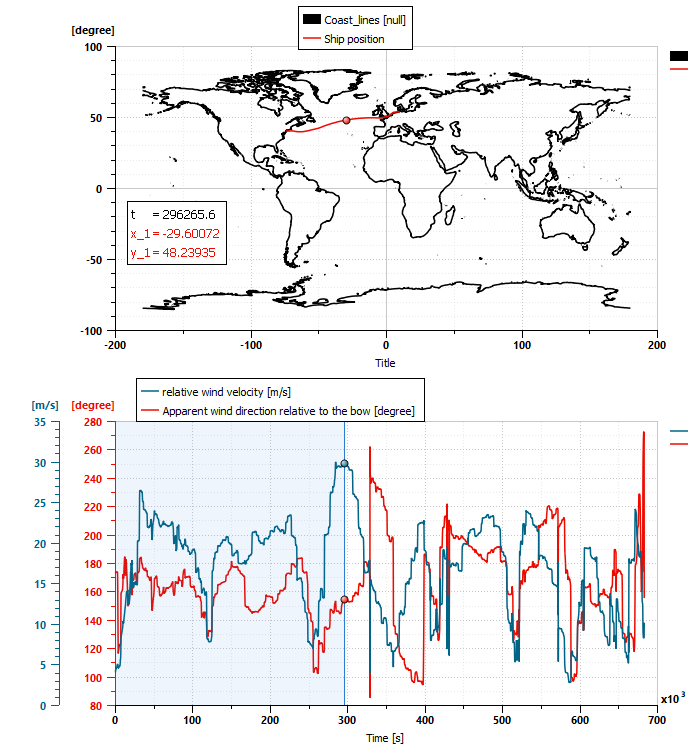
The model will account for realistic weather conditions during a north Atlantic crossing, where the wind velocity and direction will change along the route in a range of what is to be expected, on average, for this specific travel.
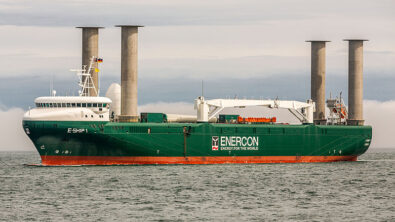
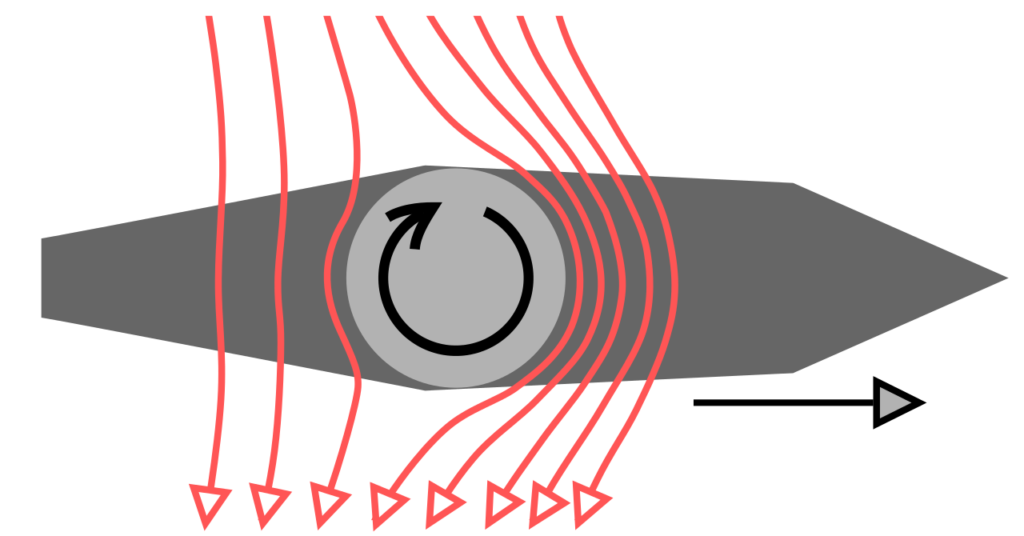
Flettner rotors were invented during the 1920s by Anton Flettner, an aviation engineer. When rotating, the rotors generate a propulsion force due to the difference in the airflow velocities and pressures on both sides of the rotor; this is called the Magnus effect. This effect is well known to the general public, as it causes football players freekick to bend and score.

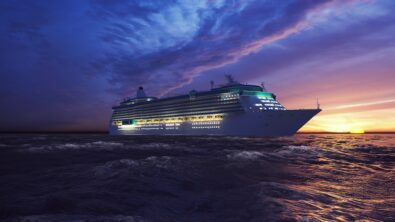
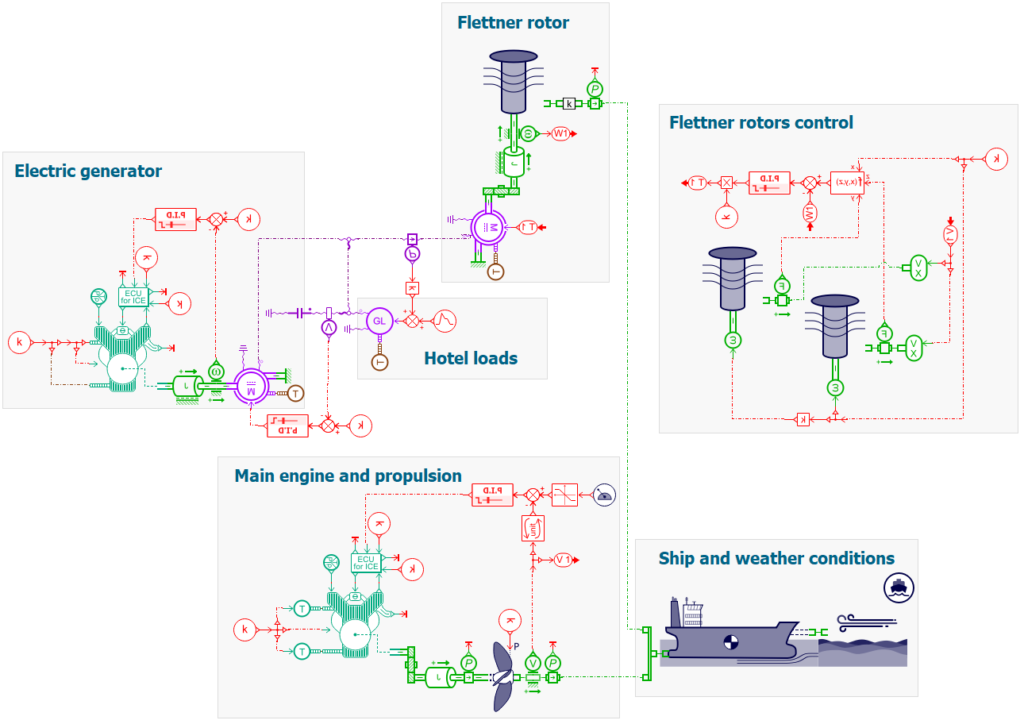
In this example, we take an existing cargo ship with only diesel engines and evaluate its fuel consumption during a north Atlantic journey from Europe to the United States. For accurate simulation, we also consider the hotel loads, the auxiliary engine fuel consumption, and the effect of the wind, waves, and current on the hull resistance.
Then we run the same simulation, but this time with retrofitted Flettner rotors. Simulating the different number of rotors installed, from 2, 4, or even more, is easy. In this example, we only added two.
When using wind-assisted ship propulsion systems, their influence on the total fuel consumption will not be the same depending on the vessel’s cruise velocity. As the thrust they provide is linked to the wind velocity and direction, their contribution to the total thrust becomes lower as the ship goes faster.
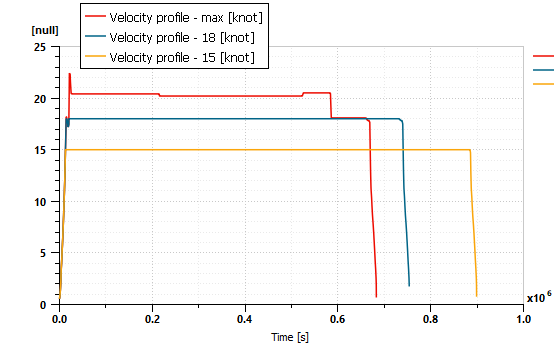
This example showcases three different cruise velocities: 20 knots, 18 knots, and 15.
Rotors and propellers thrust
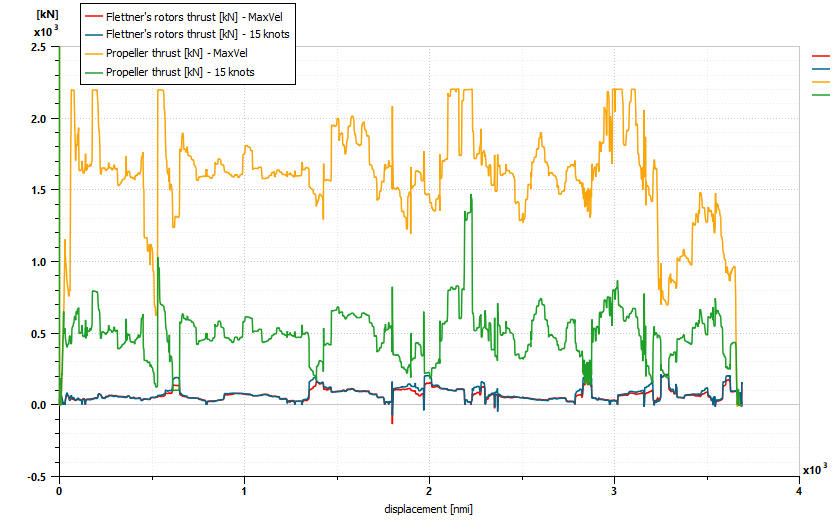
The above plot represents the thrust generated by the rotors and the propeller for two values of maximum velocity: 20 knots and 15 knots. The thrust generated by the rotors are similar (blue and red curves); the differences come from different apparent wind directions and velocities impacted by the ship’s velocity.
As for the propeller, the thrusts generated for the two cases (15 and 20 knots, respectively, with green and yellow curves) are vastly different, as less power is required in the 15 knots case.
Finally, the thrust provided by the propeller is always higher than the one provided by the rotors. They are not the primary propulsion source, but they are there to assist.
Energy contribution
To better understand the relative contribution between the rotors and the propeller, we can look at the ratio between the energy provided by the rotors and the propeller.
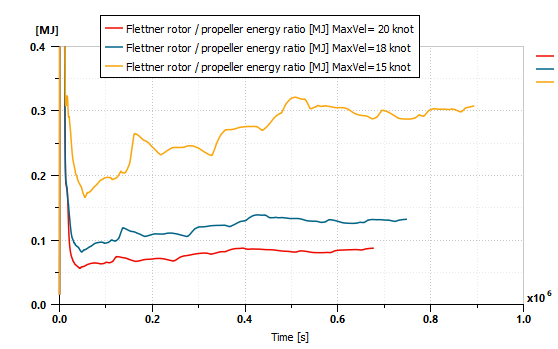
As the maximum velocity decreases, the energetic contribution of the rotors increases. In the 20-knot case, the rotors contribution is between 6% and 9%, 9% and 14 % for the 18-knot case, and 20% to 32 % for the 15-knot case.
This shows that reducing the maximum cruise velocity increases the interest in wind-assisted propulsion, as the rotors have a higher contribution. Obviously, the downside of a reduced speed is a longer travel time: 7.8 days for 20 knots, 8.7 days for 18 knots, and 10.3 days for 15 knots.
Power consumed by the rotors
Rotating the Flettner rotors requires a certain amount of power provided by the electric motors. Then to actually consume energy, a resistive torque needs to be computed; this is the role of the inertia submodel because the rotors submodels do not compute a resistive torque. This resistive torque, calculated by the inertia submodel, is due to its inertia during acceleration phases and frictions (dry, viscous, and windage) during all stages.
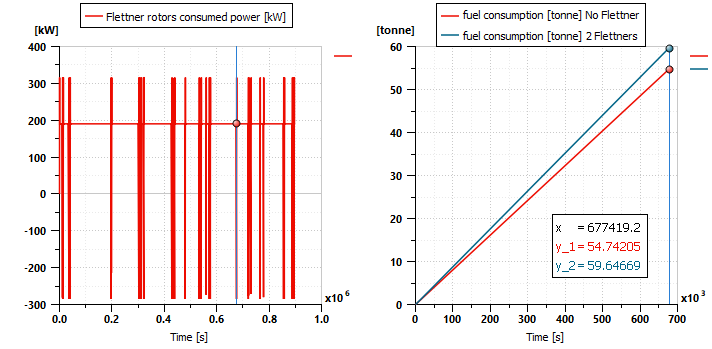
These plots show the power consumed by the Flettner rotors, approximately 200 kW in a steady state. The negative values of power mean that the rotors are slowing down in order, for example, to reverse the rotational direction.
The plot on the left side shows the amount of fuel needed with and without the rotors. Adding the Flettner rotors increases the fuel consumption of the auxiliary engine by 5 tonnes.
Total fuel consumption, CO2 emissions
Finally, we can plot the total fuel consumption and CO2 emissions, compute the different gains when the ship is retrofitted with the rotors and/or reduce the maximum velocity.
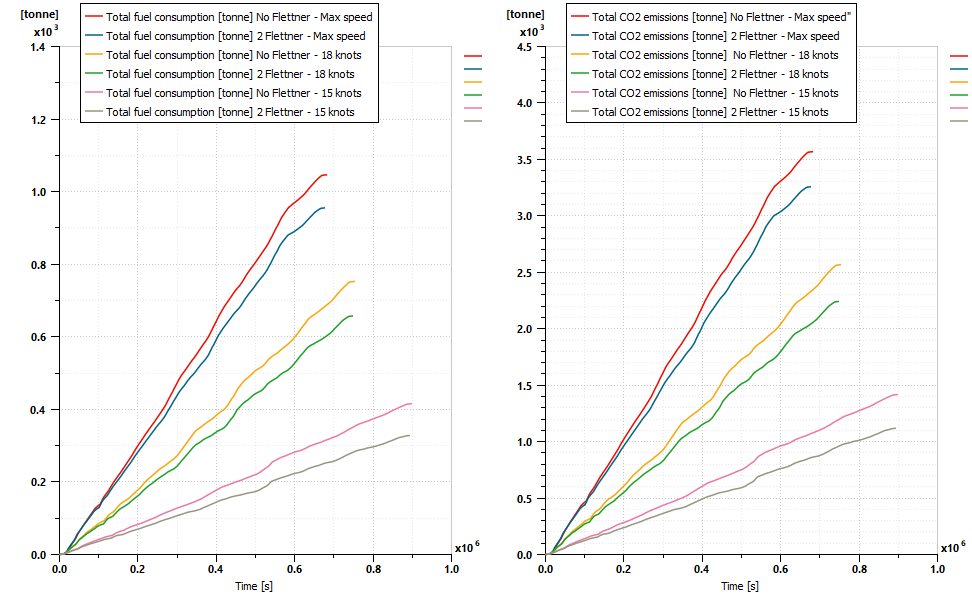
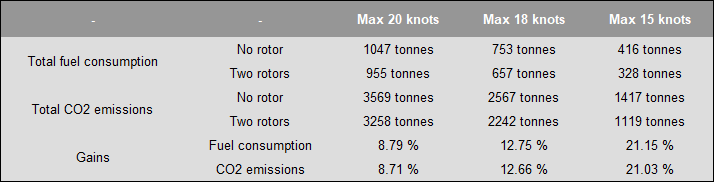
The gains in fuel consumption and CO2 emissions are between 8 and 21%, depending on the maximum velocity. As expected, the relative gains are higher when the maximum velocity is reduced. Moreover, the gains are up to 68% when we compare the 20-knot case without rotors and the 15-knot case with two rotors.
To conclude, this model shows the benefit of wind-assisted propulsion when the cruise speed is reduced. Moreover, this model is flexible as it allows you to easily test different numbers and sizes of rotors and the propulsion system performance on other routes.
Watch the video below to learn more on this feature:
Learn more on Simcenter Amesim 2210
- Read the blog post on the new features of the Simcenter Systems 2210 release
- Watch the video to discover the new features of Simcenter Systems 2210