STAR-CCM+ v13.02: Win the race against time!

“The true currency of life is time, not money, and we’ve all got a limited stock of that”, says Robert Harris.
“Time is what we measure in minutes, hours, days, and years.” That’s the literal dictionary definition. We often hear “time is money”, another legitimate perspective. My personal definition of time is a bit different. For me, time is the most precious thing in life, ironically it’s also priceless. You can’t own it, but you can use it. You can’t keep it, but you can spend it. Once you’ve lost it you can never get it back. But how to make sure we value time? I keep telling myself that I am always running against the clock, at work and at home.
Even things that look quite simple at first glance can nowadays become really time consuming. I recently tried to buy a pair of skis, without being an expert on the current technology. I ended up spending hours navigating multiple websites, trying to understand the differences between dozens of designs, models and brands without being able to make up my mind. I wished for a tool to help me to expose the differences of each design based on each variant dimensions, weight, rigidity, versatility and price. This is a common issue for us all, not just in shopping, but in life. We are faced with so many choices that we get lost in indecision while trying to compare all the hundreds of parameters.
Design exploration faces similar challenges. You run an exploration and end-up with hundreds of designs. Now what? Is investing a lot of time the only way to analyze and compare your designs to understand the pros and cons and make the right engineering decisions? Fortunately, not!
The new Parallel Plots feature in Design Manager, released in version 13.02 of STAR-CCM+, is the key to help you save time navigating your many designs. This feature is meant to quickly and efficiently compare multiple designs and provide you with a greater understanding of your design dependencies between variables, constraints and performance goals. This way, you will increase your product knowledge and get to better engineering decisions, faster!
For each design evaluation, a line links the specific variables and responses displayed in your parallel plot. Overlaying these lines for feasible designs highlights common trends and parameters values influencing your responses and also provides you information on results’ sensitivity to parameters. For instance, a narrow band of lines for a given parameter indicates that this parameter significantly influences your response. We can have one or multiple narrow bands for one parameter, meaning either one or multiple design families meet the desired performance. If the narrow band meets a bound of the parameter range, this also indicates a chance to find better designs if the variable range can be adjusted. Contrariwise, if the parameter shows a wide band, it could have a little influence on the performance. The parallel plot below is an example on an airfoil optimization study.

All the designs in the parallel plot show a good compromise between high lift and low drag. The TranslateTrailingFlap_X parameter varies significantly while meeting the desired performance whereas the TranslateTrailingFlap_Y parameter shows two narrow bands suggesting two different families of better designs. These two narrow bands are located at the bounds of the parameter range, suggesting that extending this range can increase the number of feasible or even better designs. Analyzing your results’ sensitivity to parameters using parallel plots will then help you intelligently readjust your variable ranges and/or release some constraints to enlarge your chances to find better designs for future exploration studies.
Comparing error and successful designs together using the parallel plots helps to understand the reasons of failure and identify what parameters and associated ranges are creating those errors. For example, you can highlight which physical parameter prevents the simulation to converge or, most generally, which CAD parameter is preventing the new CAD model to generate.
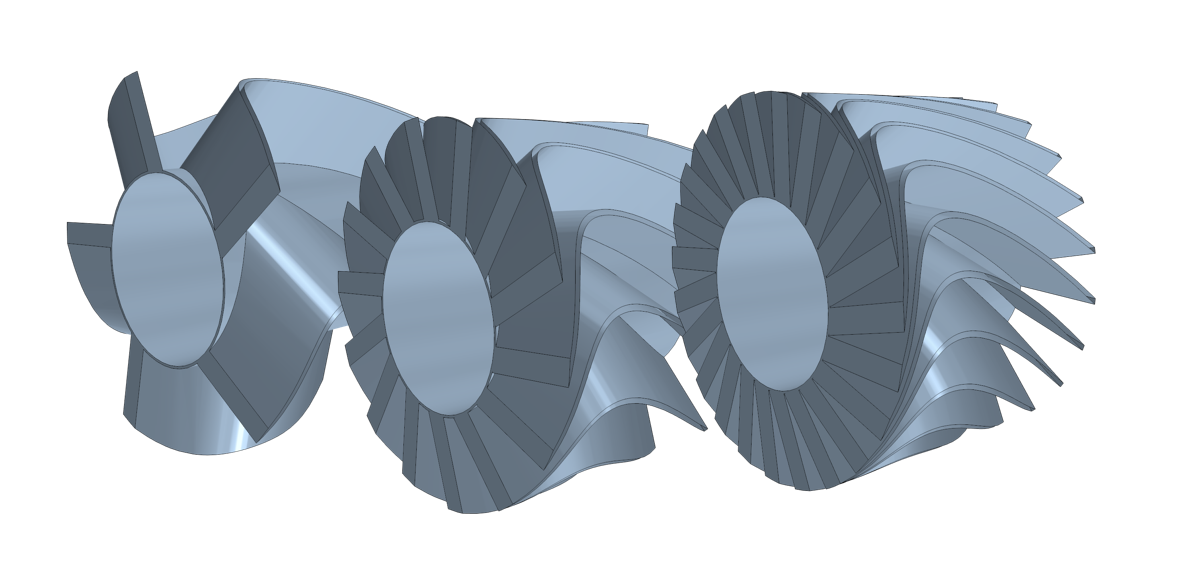
The parallel plot below illustrates the results of a design sweep study on a static mixer. In this case, we notice that we end up having 37% of error designs in the final results. This parallel plot helps us visually understand that P_CurvePosition is the parameter creating the major issue, especially when its value is below 0.08. This information, easily extracted, is crucial to guide our future variable range choice. For instance, setting a minimum value to 0.08 for this parameter will help us achieve a fourfold decrease in error designs. Now, if we closely analyze the error designs, particularly the reason of the failures, we notice that they are all due to an issue in the CAD model regeneration.

Luckily, our unique hybrid and adaptive search technology automatically handles any error designs. However, having the possibility to anticipate the areas of the design space causing such issues prior to running our exploration study would again help us not only save time but also ensure confident and more qualitative results. During any exploration study, the model regeneration steps typically complete in a few seconds whereas the subsequent simulation for each design can take several hours. Clearly, a large number of errors in the parametric model can cause significant delays in your Design Manager study and also prevent the search from exploring good regions of the design space.
The CAD Robustness study is a new feature of Design Manager, released in version 13.02 of STAR-CCM+, which will help you avoid such uncomfortable situations where time and resource are simply wasted. The CAD Robustness is a preliminary CAD model regeneration evaluation that will automatically generate your CAD model variants and expose different design variables combinations based on your CAD parameters’ ranges and sampling method chosen. The synchronization between scenes, plots and design tables will help you analyze the results and guide you towards potential set-up improvements.
Prior to any design exploration study using CAD parameters, the CAD Robustness study will then help you identify any potential errors in the parametric model to resolve them and/or ensure an appropriate selection and valid combination of parameters and associated ranges. This way, the search will avoid any bounds of the design space that are not feasible and concentrate on the parts of the design space presenting less risk of CAD regeneration issues. Hence an increased quality of search coupled to time and resource savings!
Time is what we value most, we need to make good use of it, right? That’s what we aim with our new Design Manager top features. I wished I could have had a parallel plot feature to help me choose my skis… I finally decided to go for a pair of Rossignol Sky 7 and believe me, if you’re looking for good versatility and nice off-piste sensations, you can go for it!
You can also learn more about Design Manager by watching the Extract higher value from your simulation process with Design Manager webinar or reading the Innovate faster with Design Manager blog.


Comments
Comments are closed.