Simcenter STAR-CCM+ v13.06: Overcome conflicting goals with the right compromise

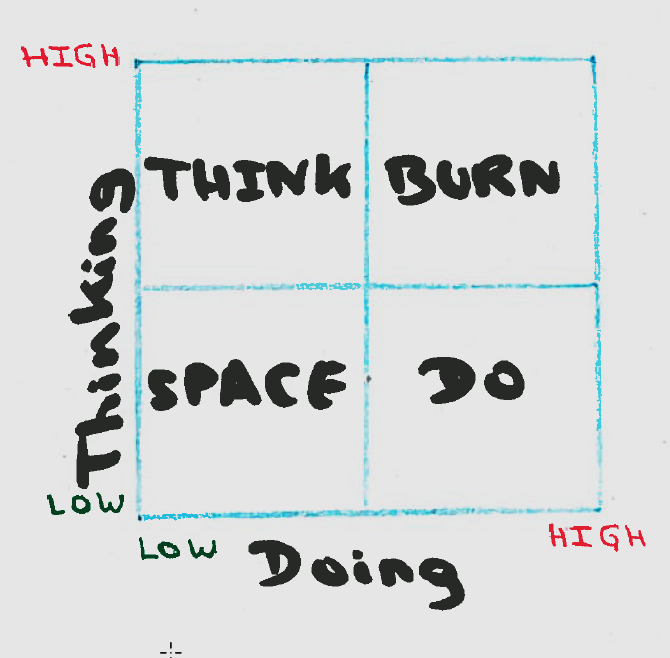
Our world is changing and becoming increasingly complex. I feel that every day we are facing more and more challenges implicating conflicting goals, both in personal and professional lives. We keep hearing “more”, “better”, “faster”, and “cheaper”. No matter how conflicting those words are to each other, we want them all. I recently noticed that I had very little free space in my work calendar for the upcoming weeks, many blocks filled out with travels, meetings or calls. I got quite concerned about the lack of time I actually had to get my work done. This reminded me of an article I read which nicely captured this issue in the form of the two-by-two matrix below.
The bottom axis is “doing”, basically all the meetings scheduled in my calendar, the left axis is “thinking”, meaning the time I need to prepare and get my work done. We always happen to be in one of the four boxes. The “Space” box is the perfect opposite of “Burn” one: low thinking, low doing. It’s the sandy beach vacation or relaxing with a glass of wine on the terrace of your house. I always get teased by my American colleagues because we get a lot of “Space” box in France, lucky us! In the “Think” box, your mental is actively working and doesn’t allow you to do much. The “Do” box is pure activity without giving any chance to your mind to think. Obviously, Thinking and Doing are two competing objectives and achieving success relies on the ability to move between these boxes and accept to achieve one of them at the expense of the other… The optimal answer depending on your goal for the day and the constraints you have that day.
In the industry, competing goals are present everywhere, especially in engineering. Evolving technical challenges are pushing the technology to its limits and often forcing engineers to make hard choices. Increasing performance while reducing energy consumption, increasing robustness while reducing mass, increasing comfort while reducing costs are some example of recurrent conflicting goals problems. Because every design must satisfy competing objectives, there must be a compromise among, if not the complete exclusion of, some of those objectives, in order to meet what are considered the more important of them. The overall challenge being to evaluate the cost to improve one objective in terms of deteriorating the other ones. Multi-objective optimization, also known as Pareto optimization, is then relevant to assess the trade-off between two or more competing objectives.
In Pareto optimization, there is no single best design but multiple best designs depending on which objective we want to favor and which one we are ready to sacrifice. The goal is to find the relationship or trade-off among the objectives. The result of a Pareto optimization search is a set of optimal design points, also known as the Pareto front. But gathering this data is just the first step. It is crucial to then have the right visualization tools to confidently understand this relationship and the relative cost/benefit ratio between objectives. The new Pareto Plots feature of Design Manager in Simcenter STAR-CCM+ v13.06 aims to help you quickly visualize these trade-offs across designs between two plotted objectives. If you have more than two objectives, you can create a Pareto Plot for each of the combinations of the objectives.
Figure 2 is the Pareto Plot of a multi-objective optimization that was run for an industrial exhaust system aiming to decrease the pressure drop while increasing the velocity uniformity. The blue dots form the Pareto front which doesn’t tell us which design is the best but provides us information on which design is optimal for a specific trade-off between pressure drop and velocity uniformity. This information is essential to help the engineering team make choices while understanding the related repercussions.
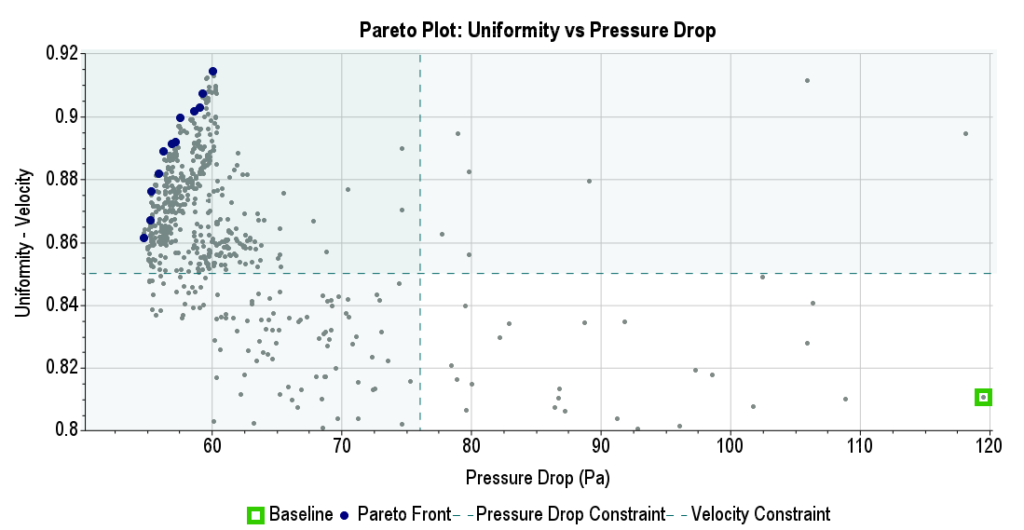
In figure 2, let’s consider the optimal point with a pressure drop equal to 54.65 Pa and a velocity uniformity equal to 0.8613 (bottom left point of the Pareto front). If we strongly need to increase the uniformity, the cost in pressure drop to reach a velocity uniformity of 0.8818 is an additional 1.22Pa (4th point of the Pareto front starting from the bottom left one). Let’s now consider the optimal design with a pressure drop equal to 60 Pa and a velocity uniformity equal to 0.9145 (top right point of the Pareto front). If this time we prefer to decrease the pressure drop, reaching a pressure drop of 57.51 Pa will cost us a decrease of 0.0581 on the velocity uniformity. So Pareto Plots will help you quickly and easily analyze your results and understand the consequences of any design decision.
The goal of a Pareto optimization search is to identify the entire Pareto front of the design space, which may extend over a wide range of the objectives. At the same time, the algorithm tries to spread out the design points as evenly as possible on the Pareto front. But sometimes, you might be interested only in part of your design space because you are aware of some constraints that limit the acceptable range of your objectives. In order to optimize the overall time of your study and focus the search on the part of the design space that is of interest to you, it is highly recommended to apply these constraints to your objectives.
That’s what we did in our industrial exhaust system case. A constraint on the pressure drop has been set to a maximum of 76 Pa and a constraint on the velocity uniformity has been set to a minimum of 0.85. In figure 2, these constraints are respectively represented by a vertical and a horizontal green dashed line. Coloring the constrained design space in green helps clearly visualize the area including the potential feasible designs. We also notice that the algorithm has focused the search towards this area of the design space since the Pareto Plot displays a higher number of calculated design variants in the top left box.
Another key benefit that Pareto Plots will provide you is the possibility to control and minimize the overall time of your optimization by monitoring its convergence. As long as your search is moving forward, each optimization cycle will provide you with new optimal points and therefore a new Pareto front. But once the search has converged to the optimum set of optimal points, the Pareto front will converge as well to reach a final state. On the video playing below, we are animating the Pareto front through our 84 different cycles calculated for our industrial exhaust system Pareto optimization. This animation captures powerfully the evolution of the optimization and highlights how the Pareto front can be used as a good convergence indicator.
Last but not least, Pareto Plots in Design Manager comes, as any other plot, with all the power of synchronization with the Design Table and the different snapshots of your study. As you can see on the video below, you can open snapshots directly from the Pareto Plot results. Clicking on any point of the Pareto Plot will also automatically update any snapshot displayed and highlight the associated design in the Design Table.
Coming back to my crazy upcoming weeks… I unfortunately don’t have a way to easily assess trade-offs between Thinking and Doing objectives as you now have in Design Manager with Pareto Plots. But as paradoxical as this can sound, I am sure that stopping by the “Space” box for a bit will help me figure this out!
You can also learn more about Design Manager by watching the Extract higher value from your simulation process with Design Manager webinar or reading the Innovate faster with Design Manager , the STAR-CCM+ v13.02: Win the race against time! and the Simcenter STAR-CCM+ v13.04: Who’s driving this time? blogs. For full information about Simcenter STAR-CCM+ v13.04 please visit the release site.

Comments
Comments are closed.