Simcenter STAR-CCM+ 2019.2: Imagining the Art of the Possible with Screenplay
“There’s nothing in the world more powerful than a good story” quips Tyrion Lannister in the HBO series finale of Game of Thrones (no spoiler here, not to worry). Effective visualizations are the stories we tell about our simulation efforts which drive and validate our design choices. The best stories speak to a wide audience, reducing the time needed for all our stakeholders to first understand and then make well informed, rapid decisions. Along the path towards authoring your story, authors like Edward Tufte [1][2][3] and Andy Kirk [4] inspire us to wring the last bit of consumable information from every single pixel in every image we plan to share. Still, trying to tell a good story from a single image isn’t easy. But. What if you weren’t limited to a single image? What if you could use hundreds of images instead? Now you can with Simcenter STAR-CCM+ 2019.2. Its time to upgrade the visual impact of your stories with Screenplay, our advanced animation capability.
In the Screenplay story below, we see the transient process of particle separation in a cyclone. We’re leveraging our Solution History capability to play back the stored Lagrangian particle time history information. At a Solution Time around 1.140 s (shown in the lower left corner), look for the smaller particles starting to get drawn into the center and pulled upward, eventually exiting from the top of the cyclone. As the animation advances, we follow the larger particles as they make their way downward to the collection exit.
Could you get this comprehension from a single image? Citing Frank Herbert, one of my favorite authors: “A process cannot be understood by stopping it. Understanding must move with the flow of the process, must join it and flow with it” (First Law of Mentat) [5]. You may well ask: This seems involved, how hard is Screenplay to use? We’re delivering a user experience with a focus on ease-of-use. For our cyclone story, you need to define two “Actions”. “Action 1” defines the start, stop and range of interpolation for the Solution History states. “Action 2” defines the Scene Views that we are going to interpolate between. You can think of Solution History and Scene Views as our two “Actors” starring in this story. Using just two drag’n’drop interactions, you can quickly storyboard two overlapping “Actions” featuring our two different “Actors”. The stage directions for each “Actor” are articulated by the “Keyframe” markers, within each “Action”. That’s it.
 Screenplay user interaction basics
When reviewing simulation results, we commonly reduce informational detail, narrowing our focus to get a better understanding of what’s going on. With Screenplay, you can bring any concept to life. Data Focus is a long-standing Simcenter STAR-CCM+ capability to explore “what if” questions. In the Sandia D Flame simulation below, we want to know, for a given Mixture Fraction range, what is the corresponding Temperature and Mass Fraction of O2? Next question, what is the Mass Fraction of O2 at higher Temperatures? Flipping that question around, what is the Temperature at lower values for the Mass Fraction of O2? Finally, what happens when the Mass Fraction of O2 is low for the mid-range values of Mixture Fraction 0. All these questions can help to inform if, or whether and hence where, there is unburnt fuel, giving us greater insight into this combustion process. Screenplay lets us modify our Data Focus filters, showing the impact on our flame visualization at left and our Heatmap plots on right. All these questions are easily explored in an animation with a playback length less than 30 seconds. It’s important to not overlook these short animation efforts – not everything needs to feel “Hollywood” and with Screenplay, it is easy to overdo. Paraphrasing Dennis Roth slightly, I would urge that “If it takes a lot of [frames] to say what you have in mind, give it more thought.“
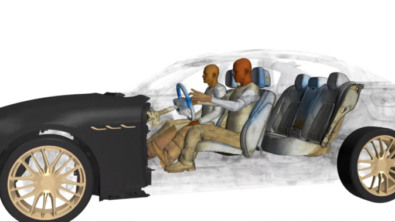
You need communicate context to understand complex simulation results,and Screenplay is extremely well suited to the task. In the animation below, we first establish context with a single layer of information – the placement of people and furniture in a room that we want to keep cool. Next, we use Screenplay to progressively reveal the next layer of information, the temperature around the room. All good to this point, except the AC units are mounted on the walls we didn’t show at first. We easily swing the room around to a new view, showing where the AC units are placed on the walls. Streamlines coming from these AC units help us complete the story. I’m pretty sure I wouldn’t want to be the person sitting right in front of that AC unit on the far right.
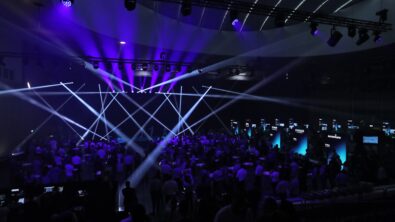
Screenplay lets you explore abstract ideas. In this story, small massed particles are used to visualize mixing patterns. This example has a lot of layers of information – we’re also seeing pressure fluctuations on the baffles. And, we’ve added all sorts of lighting cues to help our visual comprehension. And, we’ve added a (hopefully memorable) twist, building on an interactive capability in Screenplay called “scrubbing” which lets you move back and forth on your timeline, to preview your work in progress. By storyboarding our animation to move backward in time, we’re confronted with an unconventional perspective that challenges “what we think we know”. On the topic of challenging perspectives, I’ll give a tip of the hat to my colleague, Simon Fischer, who offers some interesting evidence on how water can flow up stairways, check out his blog, “Solve the Impossible. – the hard ones are already solved“.
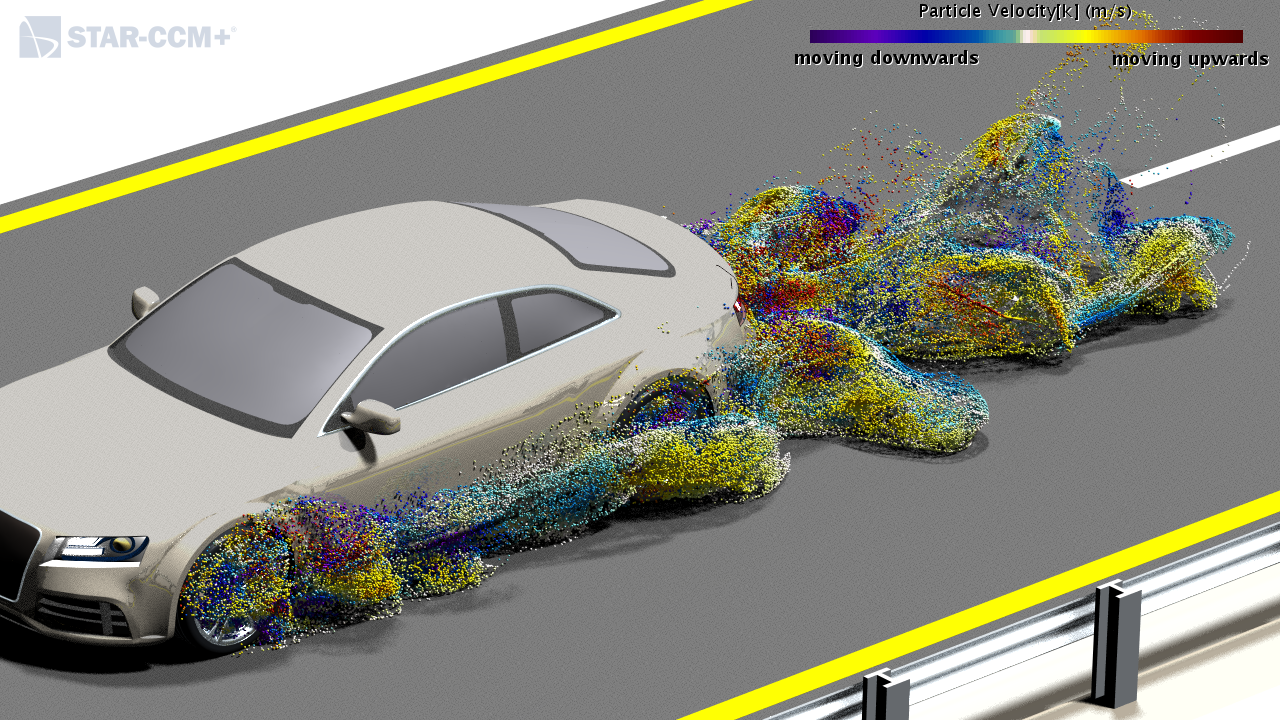
It’s true that we’re more likely to become emotionally invested in something we watch rather than read. In my previous blog post, “Colorful Fluid Dynamics? Say it again, I dare you…” I focused on a comparative sequence of images showing the simulated transport of dust particles coming from inside and around the wheel wells of a notional car travelling down a road. In the first of two Screenplay stories relating back to this “car down the road” simulation effort, we’re looking at massed particles seeded along the A-pillar and just behind the sideview mirror. There’s some rich, and subtle, visual detail here which I’ll leave you to discover on your own. But far more importantly, this story nicely illustrates the periodic phenomenon of vortex shedding behind the side view mirror. The shadows of the particles on the road surface can even give you a rough estimate of the physical distance between large-scale shedding events coming off the side view mirror.
Lastly, relating to the sequence of images I presented in my previous blog post, I show the fate of the simulated dust particles coming from inside and around the wheels. I’ll admit, I enjoy driving on rainy days just so I can watch the interplay of water droplets and moving traffic. There’s a lot of engineering insight to be had here, and honestly, I hope that many of you can find this as mesmerizing and compelling as I do.
What I’ve hoped to accomplish is how your Screenplay stories can grab and keep the attention of your stakeholders, and at the same time improve their recollection of your simulation efforts. Here’s a question: “Was there any animation in this blog post that you didn’t watch all the way thru to the end?” Animations inspire a feeling of suspense – it’s very hard to look away. There’s also the FOMO phenomenon (Fear Of Missing Out) at work here – you absolutely need to know what’s going to happen next. This is a level of engagement that single images simply cannot reach. Here’s another question: “How many times did you watch the same animation, over and over?” I’ll speculate, that at least for a few, more than once. And, when you do watch an animation more than once, it’s evocative – your stakeholders are going to become more personally connected to your story and that’s absolutely a desired outcome.
Tyrion Lannister did get the lion’s share of the good wisdom-filled quotes in Game of Thrones. I’ll end here by paraphrasing him: “I use Simcenter STAR-CCM+ and I know things”.
References
[1]. Tufte, E., “The Visual Display of Quantitative Information” (1983), Graphics Press, Cheshire, Connecticut
[2]. Tufte, E., “Envisioning Information (1990), Graphics Press, Cheshire, Connecticut
[3]. Tufte, E., “Visual Explanations” (1997), Graphics Press, Cheshire, Connecticut
[4]. Kirk, A., “Data Visualization” (2016), Sage Publications Ltd, Thousand Oaks, California
[5]. Herbert, F., “Dune”, (1977), p.32, Berkley Edition, New York, NY