Race to the clouds: Battery thermal behavior simulation of a Tesla Model 3

Simulate the Pikes Peak Hill Climb with a Tesla Model 3 and check in details the battery thermal behavior
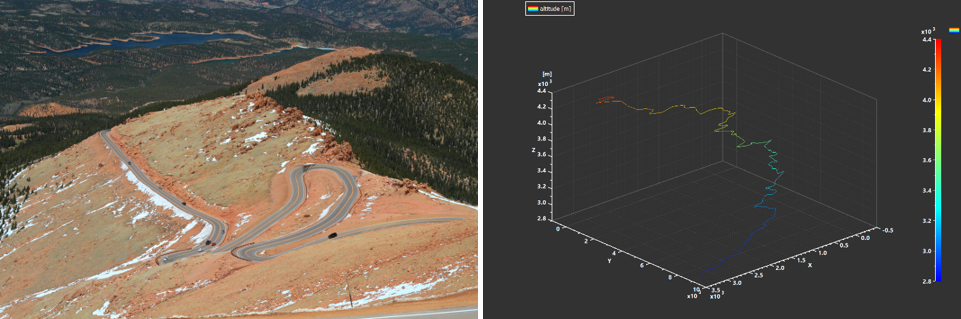
Every year in Colorado since 1916 reckless drivers are challenged to get as fast as possible to the Pikes Peak summit at 4301m high, facing a close to 20km track with 156 turns and 1440m elevation gain.
As a sign of electric vehicles maturity, the new race record has been beaten in 2018 by a full electric vehicle in 7 minutes and 57 seconds.
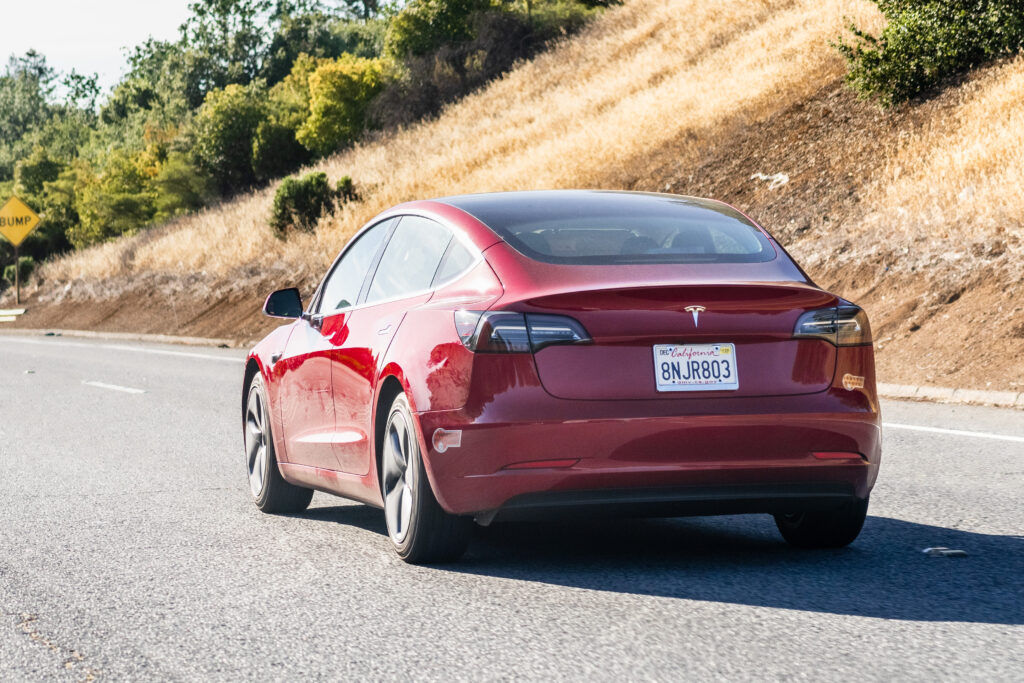
Using public-available data of a Tesla Model 3 Long Range Rear Wheel Drive Standard version, let’s use Simcenter Amesim to perform a battery thermal behavior simulation of a Tesla Model 3, while climbing up as fast as possible to the summit – for more information and demo, you can also watch our webinar on “Designing optimal battery thermal management using system simulation” here.
Electric Vehicles battery thermal management challenges
The main element of an Electric Vehicle (EV) is without any doubt the battery system. It supplies the power to the motor while driving the vehicle range through its capacity.
Battery requirements lie on 3 main expectations, which are driving range, power and lifetime. To combine them efficiently, a system level assessment seems obvious in addition to a detailed focus of the battery pack itself.
For these 3 requirements, thermal management is of great importance since the operating temperature range of battery cells is quite narrow and commonly between 0 and 45°C (ideally between 10 and 30°C). This ensures an optimal battery lifetime and safety.
How then is the battery cooling system sized?
Well, this operating temperature range drives the sizing of the battery pack cooling system, but it is highly linked to the battery charge and discharge levels. Because of drivers range anxiety, automotive OEM’s are proposing fast charge capabilities (80% of battery capacity in less than 30 minutes), which are the most demanding regarding the thermal stress.
As a reference on the market, the Tesla Model 3 (RWD Long Range) is a logical choice for a virtual assessment of the battery pack temperature for 2 scenarios:
- Fast charge
- Pikes Peak climb
Tesla Model 3 battery characteristics
Composition of the battery pack of this Tesla Model 3:
- 2170 cylindrical cells / NCA technology / ~4.8Ah – 3.6V each
- 46 cells in parallel (= 1 brick) / 4 modules in series
- 4416 cylindrical cells in total = 80.5 kWh
- 477 kg
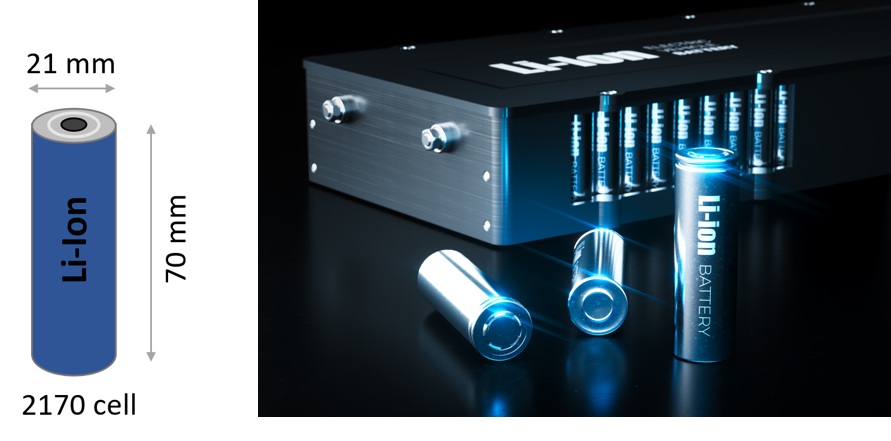
Fig 1a. Illustration of battery cell and brick (46 cells in parallel)
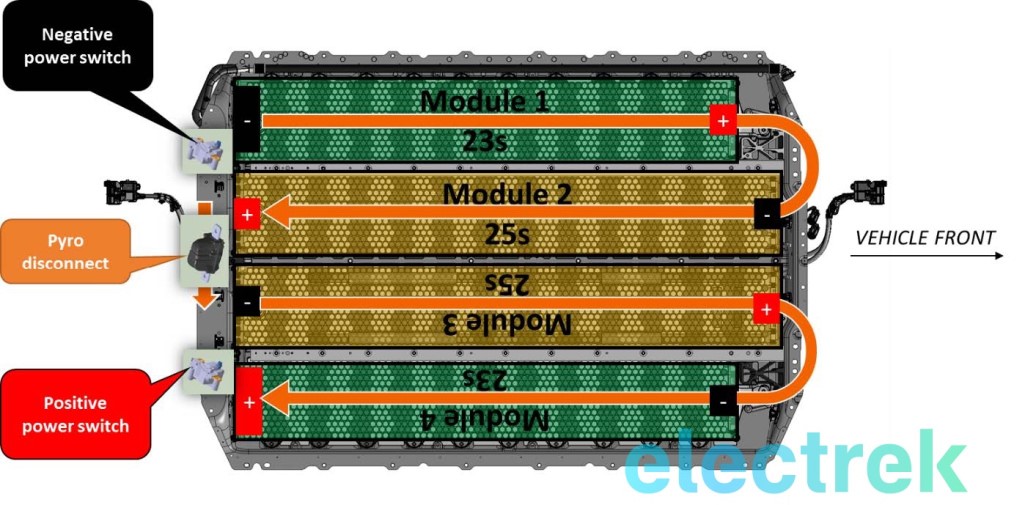
Fig 1b. Tesla 3 Battery pack modules layout – Courtesy of Electrek – https://electrek.co/2017/08/24/tesla-model-3-exclusive-battery-pack-architecture/
Tesla Model 3 cooling system battery characteristics
Regarding the cooling system, the coolant is evenly distributed along the 4 modules, featuring 7 parallel channels for each (1 channel made of 28 micro-channels), thus ensuring a proper cooling.
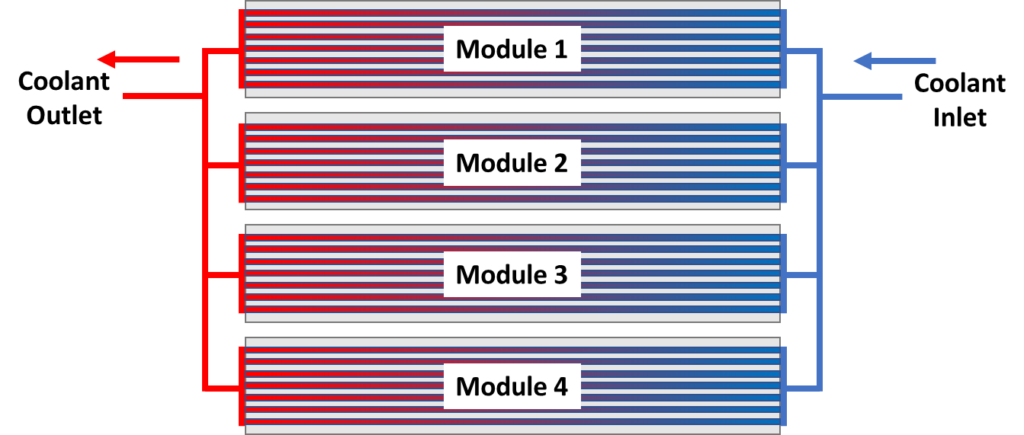
Fig 2. Battery pack cooling system flow distribution
Detailed model of the battery pack in Simcenter Amesim
According to the above-collected data, we can build a detailed battery pack model in Simcenter Amesim.
To minimize the size of the model while getting enough details, we have grouped cells into 2 bricks in series (1 brick = 46 cells in parallel)
- Electric model: regarding the electric part, we are considering a Dynamic Equivalent Circuit Model (ECM) using a pre-calibrated model from the Simcenter Amesim database as illustrated in Fig. 3. We selected the NCA High Energy cell model, with its cell capacity resized to 4.8 Ah
- Cooling model: regarding the cooling part, elements from the Thermal and Thermal Hydraulic libraries have been used and associated to the electric component through the thermal port.
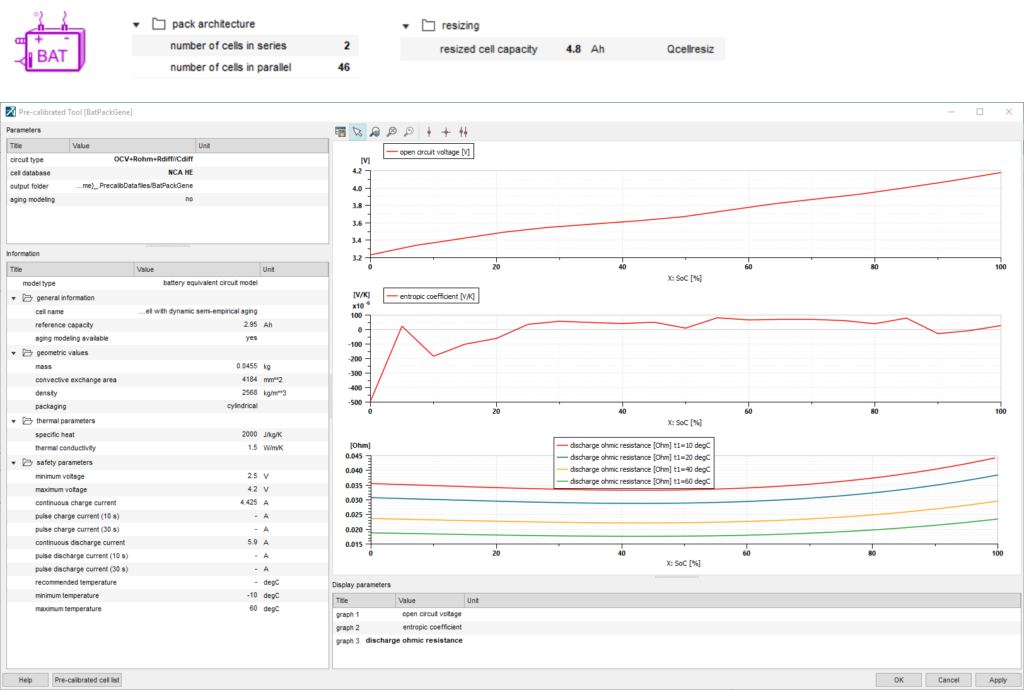
Fig 3. Battery Equivalent Circuit Model from the Pre-calibrated Tool
The combination of both elements leads to a thermal-electrical unitary pattern as described below:
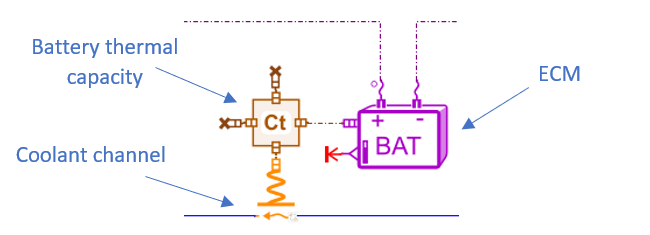
Fig 4. Battery unitary thermal-electrical model
Regarding the coolant channel, we used known geometry directly in the component together with proven heat exchange correlations from the literature, all built-in the Simcenter Amesim component.
We then build the complete battery pack from this unitary group, which leads to the following model:
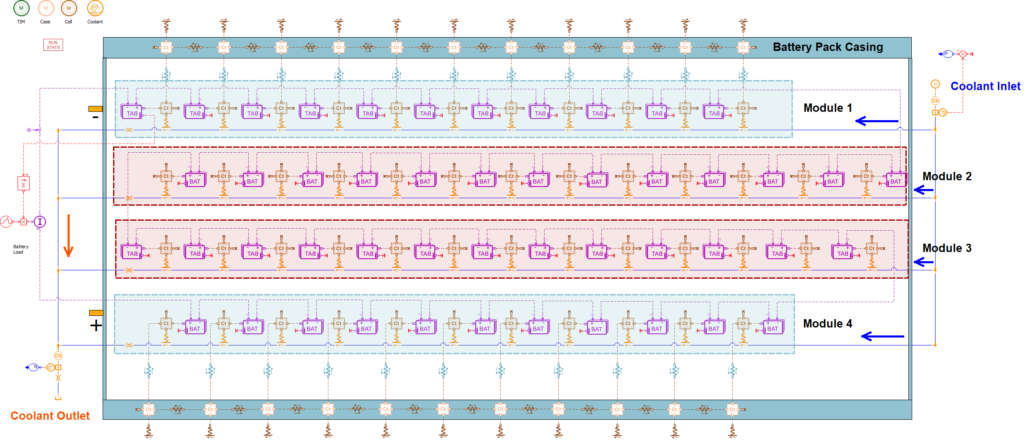
Fig 5. Complete Battery pack model
Fast charge scenario
The first scenario of this battery thermal behavior simulation with a Tesla Model 3, is considering a fast charge scenario:
- 2C fast-charge, i.e. 150kW of charging power to charge the battery pack from 20 to 75% state of charge (SOC) followed by a decreasing current (~constant voltage) till 100% of SOC
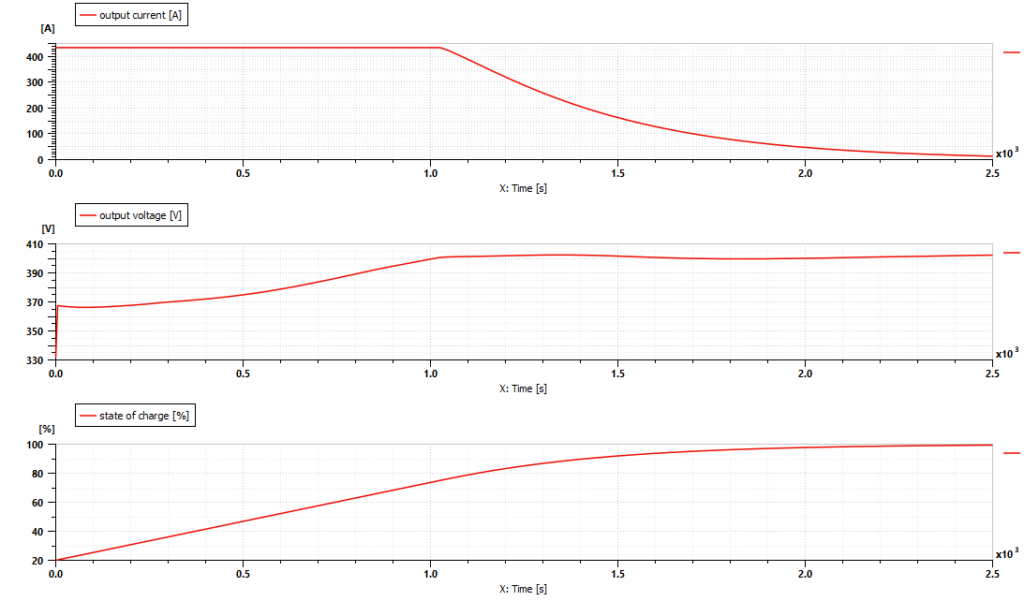
Fig 6. Fast charge scenario
During this fast charge, we fix the coolant flow to 30L/min at an inlet temperature of 25°C.
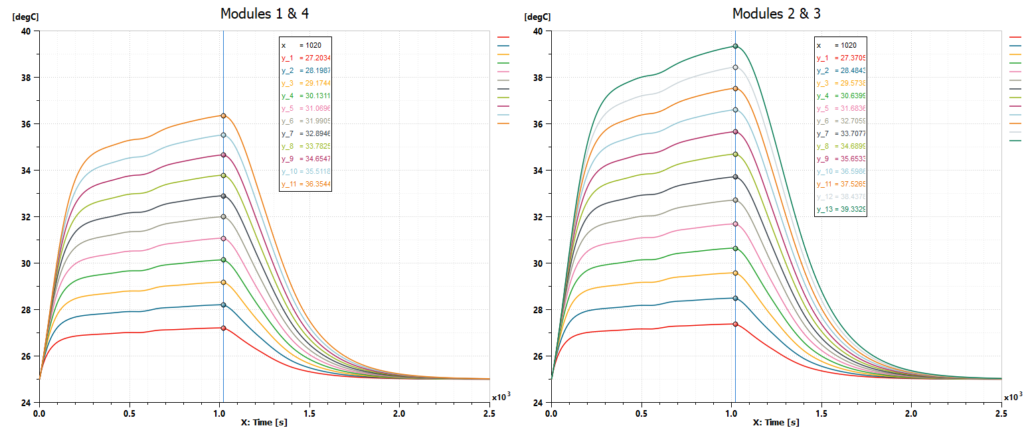
Fig 7. Fast charge scenario cells temperature results
The results presented on the above figure show a maximum temperature of about 36.3°C for the modules 1 & 4 and 39.3°C for the modules 2 & 3, which have 2 additional bricks in series. We reach this maximum level at the end of the 2C charging period.
The maximum outlet coolant temperature is close to 37°C
According to these results, we can see that the maximum cell temperature is below the 45°C limit. The cell-to-cell temperature difference is however reaching 12°C, which seems to be at the upper limit.
Vehicle and driver model
In order to perform the Pikes Peak climb scenario, and check the battery thermal behavior simulation with a Tesla Model 3, we are using a simple longitudinal vehicle together with functional electrical elements for the motor, inverter and batteries. Before addressing this scenario, let’s validate the model on a 0-100 km/h acceleration and on a WLTP cycle for the range estimation.
Regarding the electric motor, we use the Pre-sizing Motor App tool of Simcenter Amesim, which enables from an existing motor performance/efficiency curve to resize it using the few available motor characteristics as shown in the figure below:
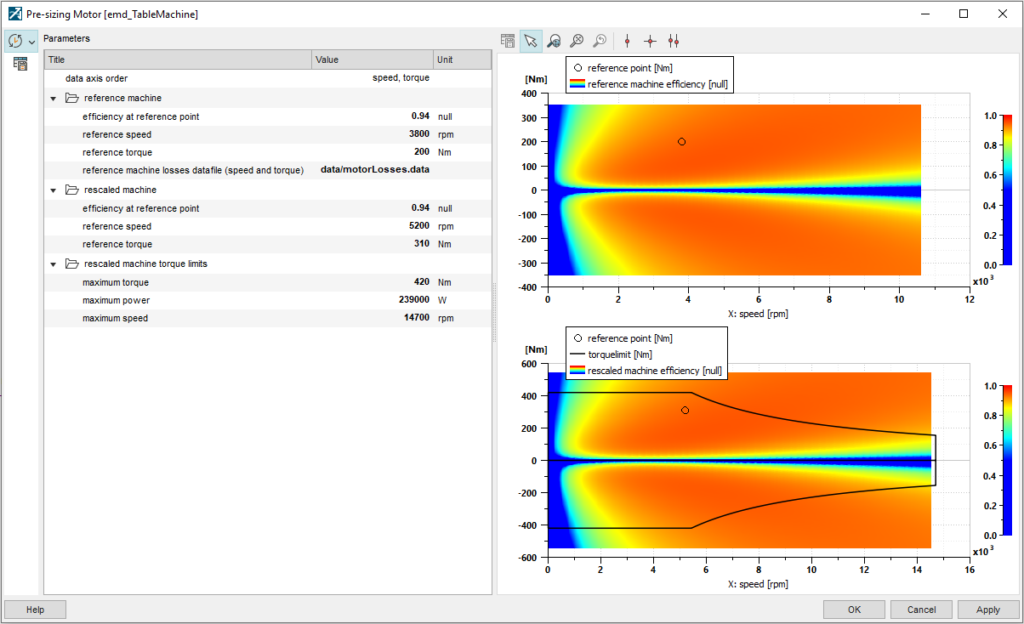
Fig 8. Pre-sizing Motor App tool
The global model is the following:
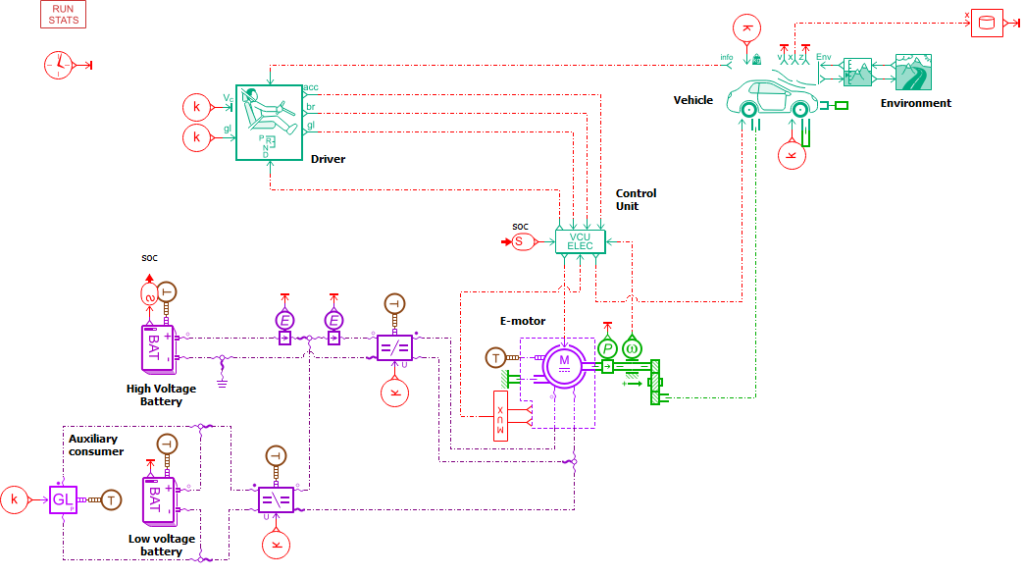
Fig 9. Global Simcenter Amesim model
Below are the results of the 0-100 km/h acceleration and WLTP cycle
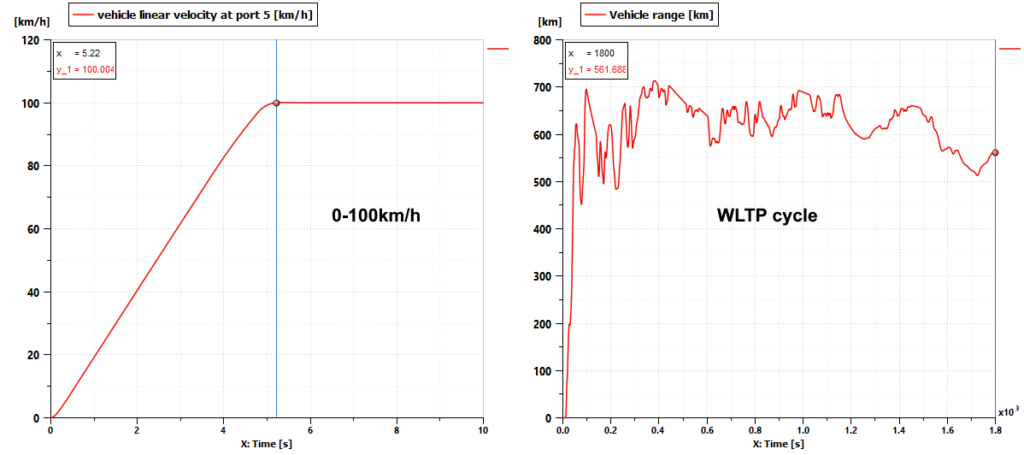
Fig 10. Simulation results for 0-100km/h acceleration and WLTP cycle
The simulation gives in a few seconds (4s for the WLTP cycle) the following results:
- 0-100 km/h in 5.22s
- Range based on the WLTP cycle: 561km
These results are coherent with the official data, the range varying from one reference to another (from 530 to 600km) and being very sensitive to the tire dimension.
Note that we calculate the range as: (100/SOC variation)*mileage.
Considering consequently that our vehicle model is correct, let’s now replace the single battery component with the detailed pack. Since the pack, made of 4 modules, is symmetrical on a thermal point of view (module 4 = 1 / module 3 = 2), we can cut it by half before integrating it into the full model as shown in Fig 12.
Pikes Peak climb scenario
Car velocity profile generation
For this scenario, since the vehicle is represented by a simple longitudinal model, let’s generate a velocity profile using the Pikes Peak GPS track in the Simcenter Amesim trajectory definition tool.
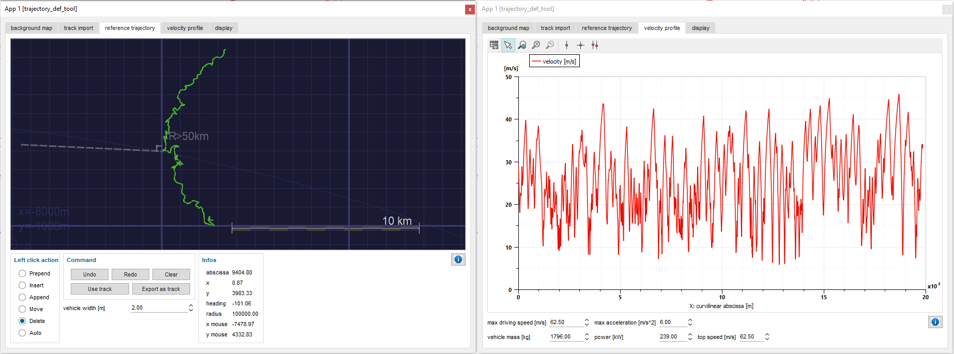
Fig 11. Generation of the velocity profile from the GPS track in trajectory definition tool
We can then use this velocity profile directly in the driver model. We end up with the following full model:
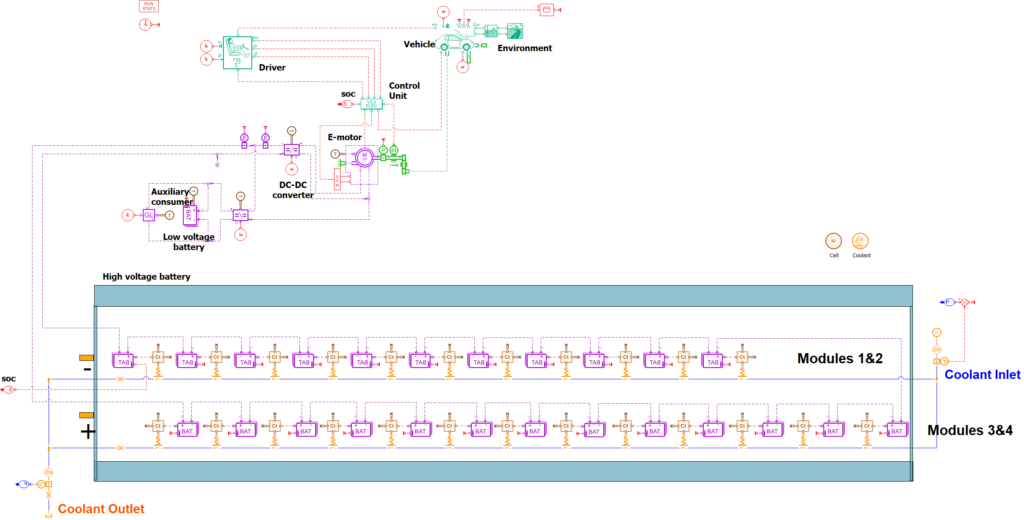
Fig 12. Full vehicle model with the detailed battery pack
Constant coolant temperature scenario
For this simulation, we are considering for the entire pack a constant coolant flow rate of 30L/min and 25°C. Thus, the resulting temperatures are the following:
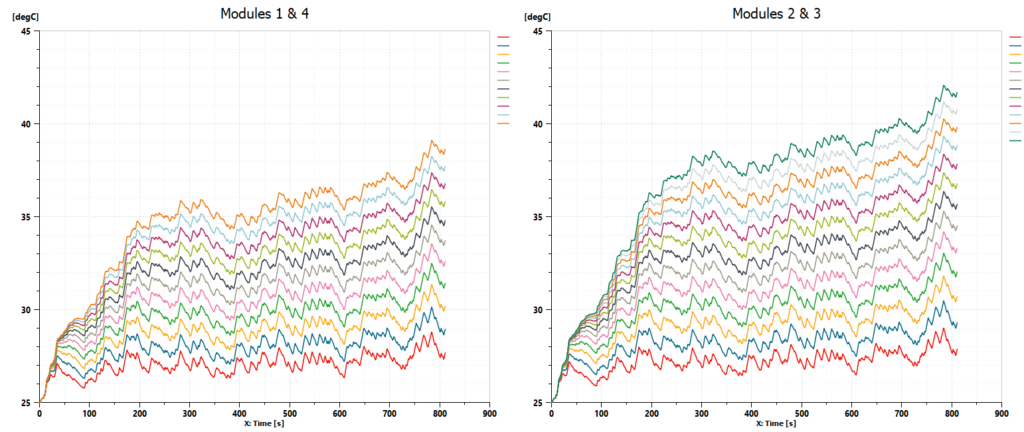
Fig 13. Battery pack temperatures results
Fig 14. Battery pack temperatures animation during Pikes Peak climb
We can see that in these conditions, battery cells stay below 45°C.
By the way did we beat the climb record? Well, not exactly but we completed the race in 13 min 32 sec, which is already excellent for an only 239kW maximum power series vehicle compared to the record holder, a 500kW race car specially designed for the event.
Note that about 25% of battery SOC have been burned, thus giving a vehicle range of about 80 km in these conditions.
Closed-loop cooling system with a low-temperature radiator
So, let’s now try to add a more realistic cooling loop to see if we can keep the coolant inlet temperature at 25°C during the climb. We are using at first a Low Temperature radiator with an average effectiveness of 0.6. Note that the ambient temperature is 25°C at start and is decreasing with the altitude at a 6.5°C/1000m rate.
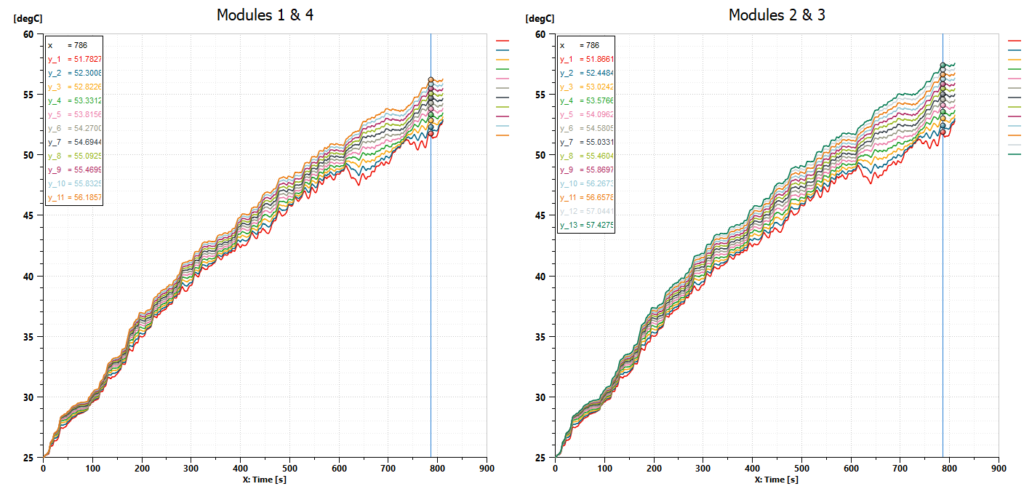
Fig 15. Battery pack temperatures with a single LT radiator
We clearly see from the results that the coolant loop with a LT radiator is not meeting the cooling power requirements since the maximum battery cell temperature exceeds 57 °C with an outlet coolant temperature reaching 56°C
How much cooling power would be needed to maintain theoretically maximum cell temperature below 45°C? Let’s consider first a maximum coolant flow of 35 L/min. To meet the above requirements, the maximum inlet coolant temperature needs to be set to 32.6°C, thus leading to a maximum cooling power of close to 22kW. Note that this supposes a constant instantaneous inlet coolant temperature, which is not realistic when considering the dynamic of the whole loop.
For a comparison, with the LT radiator, the maximum achievable cooling power was 17.5kW, which shows a 4.5kW deficit.
Addition of a chiller
Now, let’s add then a chiller component to the system, which is the case in the Tesla Model 3. From the information gathered, the chiller in this car has a maximum capacity of around 10.5kW.
For the present example, to keep it functional, let’s put it in parallel after the LT radiator with a simple thermostat, which might not be completely representative of the real system but coherent.
We hence end up with the following cooling configuration:
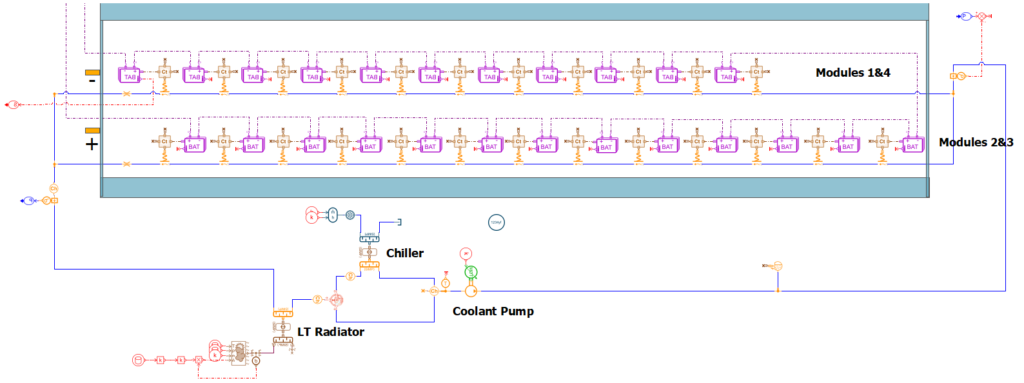
Fig 16. Battery pack cooling system with a LT radiator & a chiller
The results on the battery cell temperatures presented below show that we have met the requirements.
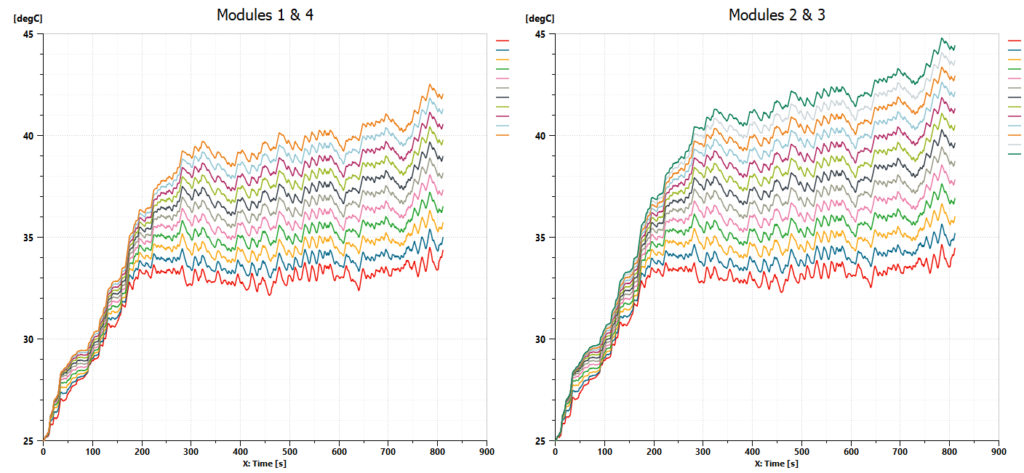
Fig 17. Battery pack temperatures with a LT radiator & a chiller
Let’s now have a look at the distribution of cooling power between the LT radiator and the chiller.
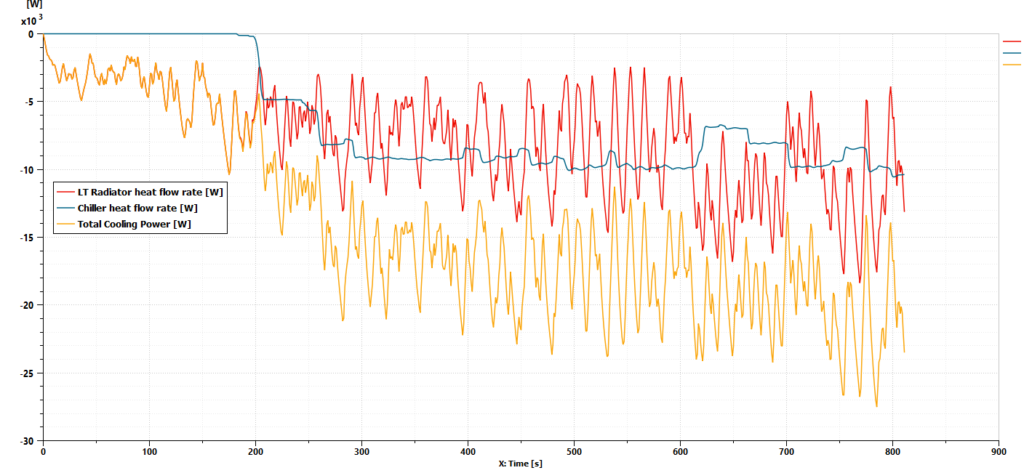
Fig 18. Cooling power from LT Radiator & Chiller
As expected, even if the maximum cell temperature is below 45°C, the transient cooling power is higher than the steady-state theoretical one. A peak of 27.5kW cooling power can be seen from the above curve.
Conclusion
We hope you’ve enjoyed the Pikes Peak Climb Hill, performing a battery thermal behavior simulation of a Tesla Model 3 !
We have demonstrated here through a step-by-step workflow that a detailed Battery Thermal Management model is bringing a high added value into your system simulation model, while giving you the possibility to quickly optimize the design of the cooling loop. We also saw that the different pre-sizing tools of Simcenter Amesim enables you to end up with realistic outputs when only few parameters are available.
This type of model is also well fitted to design derating scenarios if cells temperatures are above the pre-defined limits.
Want to learn more about improving battery fast charging experience while limiting battery aging with Simcenter Amesim, please refer to this blog post.
About the author:
Benoit Honel is a Product Manager for Simcenter Amesim in charge of Electrification. His transverse role focuses on aligning the system simulation product features with the customers accelerating vehicle electrification challenges. He strongly believes in the benefits of system simulation for designing and optimizing the electric motors, battery systems, power electronics and their control thanks to a fast and comprehensive multi-physics modeling approach.
Read more
Check out the new features of Simcenter system simulation solutions version 2020.2 in this blog post.
Need to install the latest version? Contact your local support office.


