Propeller Simulation drives your design work forward

Numerical simulation has been widely accepted as a tool to gain insight into the physical phenomena and to understand how to improve your design especially when dealing with propellers. Propeller simulation in the hands of design engineers can help increase reliability of designs.
Why reliability is an issue?
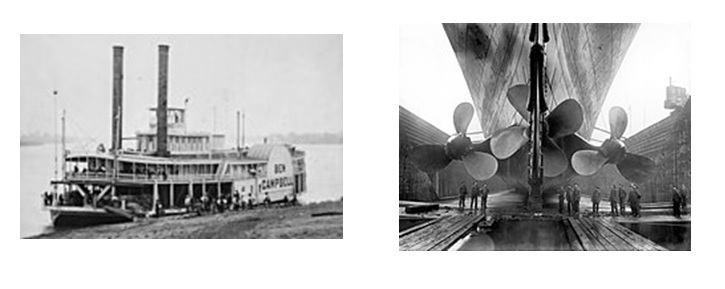
Screw propellers became a mainstream ship propulsion system in the late 19th century. Screw propellers superseded many paddle wheeler ships which were the predominant propulsion method for motor-driven ships. Since that time, screw propellers have been widely applied to fishing and pleasure boats, passenger and container ships, Very Large Cruise Oil Carrier (VLCC) etc.
Because of the long cruising distance especially for large ships, reliability is essential for propellers as well as engines. Furthermore, the propeller’s working environment i.e. under sea water is very harsh. Therefore, manufacturing screw propellers require high levels of design and production technologies. Screw propellers with high performance need to meet the following criteria: strength, efficiency and cavitation.
Cavitation refers to the phenomena where bubbles are generated in the water when the water pressure becomes lower than saturation pressure. When the propeller rotates at high speed, water velocity at the tip of the propeller becomes very high and pressure becomes low as per Bernoulli’s principle. When the cavitation area increases on the surface of the blades, it causes lowered thrust, vibration and noise. Furthermore, the energy released by collapsing bubbles causes erosion of the blades.
Challenge for design engineers
For design engineers, it is a challenge to find a design which achieves good performance due to tradeoffs between the three areas; strength, efficiency and cavitation. For example, if priority is given only to efficiency, the screw blade would need to be thinner; thus resulting in insufficient strength or strong cavitation, which would damage the ship. Therefore, it is imperative to investigate performance in the three areas. For the investigation of strength, Finite Element Analysis (FEA) and material tests can be applied, while computational fluid dynamics (CFD) and simulated experiments would be the ideal way to study efficiency and cavitation.
CFD has been established as a tool to predict fluid flow, fluid-structure interaction and more complex phenomena such as cavitation. Integrated flow parameters along a propeller surface is used to evaluate efficiency of the propeller and used as input data for structural analysis as a load. It is also convenient and cost-effective to virtually tests many variants of the products and optimize the design.
When both fast and accurate are important
A design engineer interested in using CFD to work on propeller design has unique needs that require use of a unique product. As the primary task of a design engineer is design, the CFD software used for simulation needs to be easy-to-use, powerful to handle complex (and dirty) models, accurate as well as fast to keep up with the speed of the design process. And perhaps most importantly, it needs to be embedded in CAD.
Simcenter FLOEFD is a CFD tool embedded into Siemens NX, Solid Edge, CATIA V5 and Creo. It is an ideal tool for design engineers because they can conduct CFD analysis inside their preferred CAD environment without learning a new user interface. Simcenter FLOEFD is highly automated and thanks to its unique SmartCellsTM technology design engineers can easily perform CFD simulation without simplifying the geometry. It is fast and still highly accurate to keep up with the fast-moving design environment. Let’s take a look at an example.
Potsdam Propeller Simulation Test Case
We used the Potsdam Propeller Test Case (PPTC) benchmark test case.
The data related to the benchmark test case was published by Schiffbau-Versuchsanstalt Potsdam GmbH (SVA) to test and validate simulation methodologies. A significant portion of the work undertaken by the SVA relates to research projects. With its three departments, Resistance and Propulsion, Propellers and Cavitation, and Maneuvering and Waves, the SVA covers the entire spectrum of modern shipbuilding testing practice.
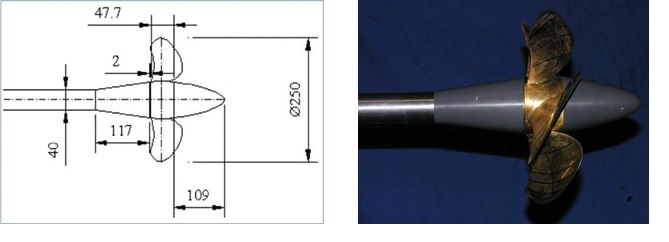
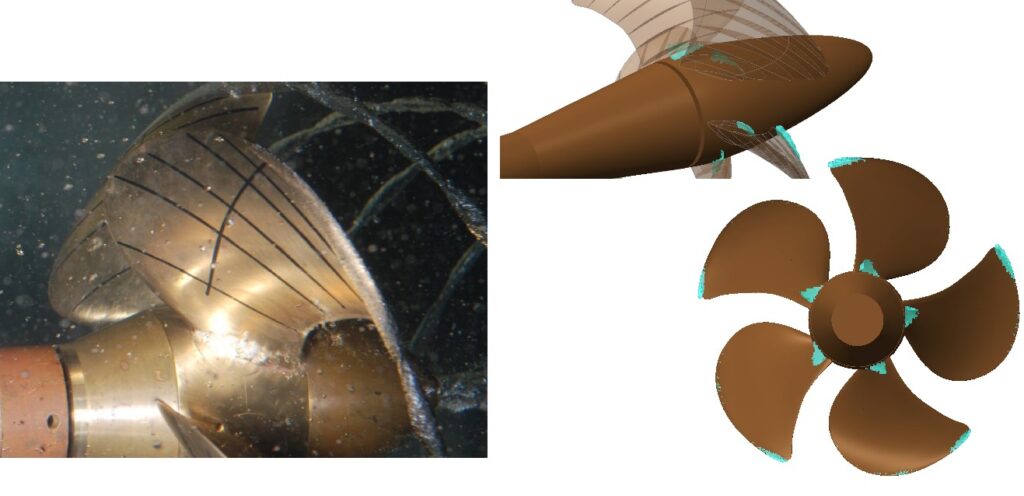
The propeller VP1304 was used for the benchmark test. VP1304 designed to generate a tip vortex, is a controllable pitch propeller with right-handed direction of rotation.
| Diameter | D = 0.25 m |
| Pitch ratio r/R = 0.7 | P0.7/D = 1.635 |
| Area ratio | AE/A0 = 0.77896 |
| Chord length r/R = 0.7 | c0.7 = 0.10417 m |
| Skew | θEXT = 18.837° |
| Hub ratio | dh/D = 0.3 |
| Number of blades | Z = 5 |
| Sense of rotation | right |
Simulation model
In the simulation for the open water test, two geometric scales of the model are considered: scaled model with a scale ratio of 12 and a full model. For these two cases, water properties slightly differ from each other and the rate of revolutions for the scaled model is 15 1/s and for the full model is 4.33 1/s. The results of the simulations for five advance coefficients J = 0.6, 0.8, 1.0, 1.2, 1.4 are compared with the experimental data. For this comparison thrust coefficient (KT), torque coefficient (KQ) and open water efficiency (η0) are considered. The mesh in Simcenter FLOEFD was created as a uniform rectangular dominant mesh with a high mesh density in the vicinity of the blades and extended in the direction to boundaries of the computational domain with some ratio. Thanks to Simcenter FLOEFD’s unique SmartCellsTM technology[SN1] , it is not necessary to resolve boundary layer by mesh. The total mesh size for this task is 6 million cells (Figure 3).
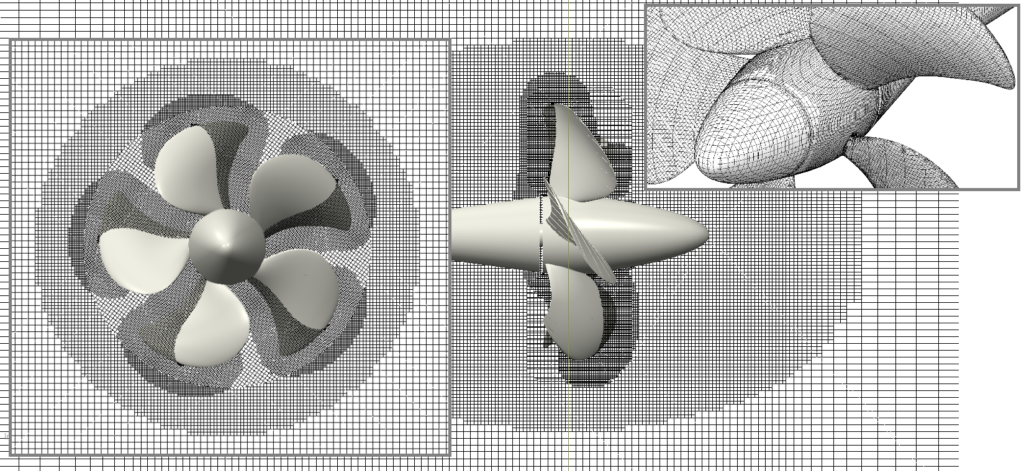
The calculations were conducted in the transient regime using the “Sliding” mesh technology to simulate the propeller rotation. The time step for the scaled model is 0.0024 s and for the full model – 0.0083 s.
| Task | Time [min] |
| Model preparation/Repair | 0 |
| Physics model setup | 10 |
| Mesh setup/Grid generation | 30 (partially computer time) |
| Solving | 350 per case (10 jobs in parallel) |
| Post-Processing | 240 |
| Total human invest | 280 (4.5 h) |
| Total time (human + solver) | 630 (10.5 h) |
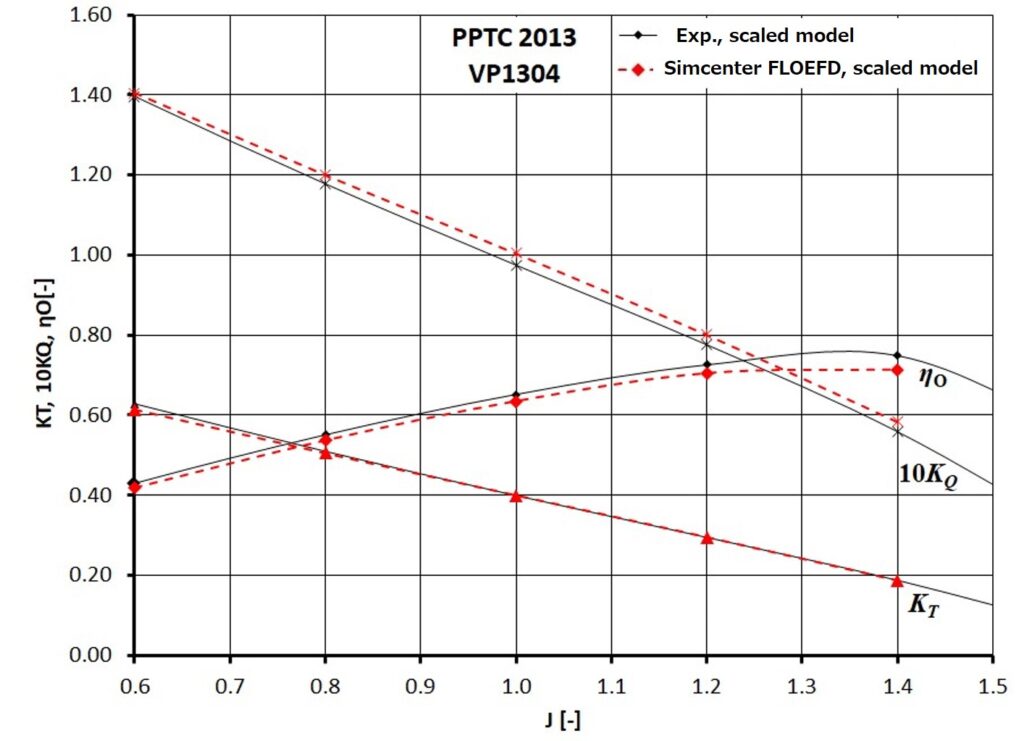
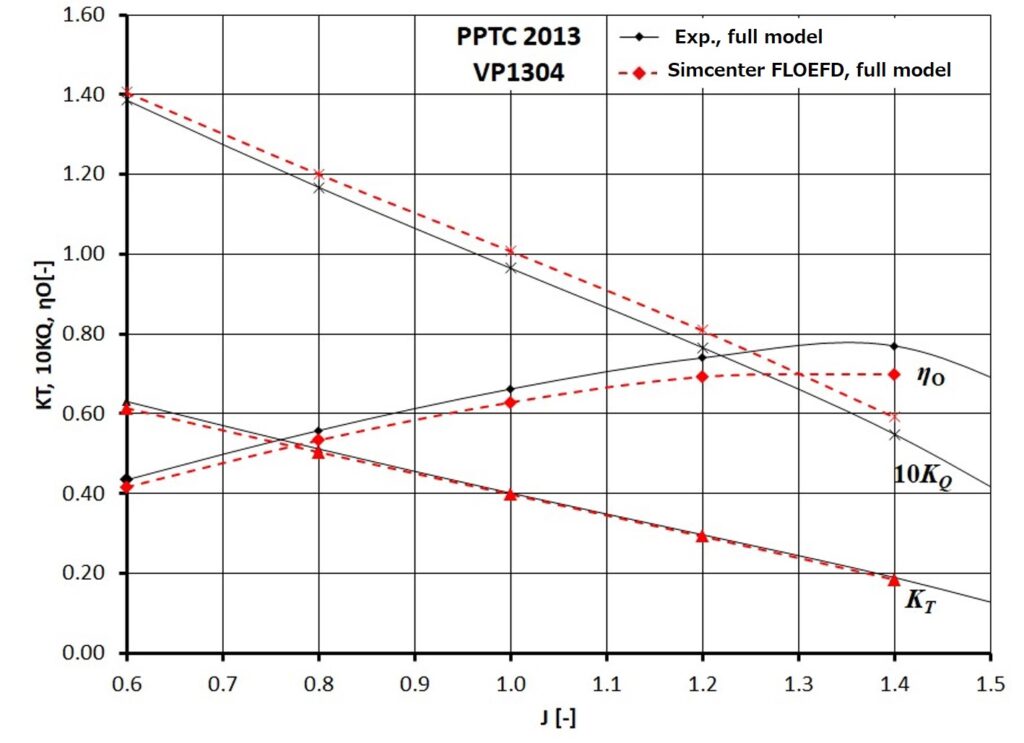
The propeller performance is usually represented using non-dimensional coefficients like thrust and torque coefficients and open water efficiency. The comparison of the simulation results and experimental data in terms of these coefficients is shown in Figures 4 and 5. These graphs show good agreement between Simcenter FLOEFD data and measurements with relative errors weighted over all advance coefficients for the scaled model of 0.62 % for KT, 2.65 % for KQ and 3.18 % for η0. For the full model these errors are 1.69 % for KT, 4.46 % for KQ and 5.86 % for η0. All data show that KT and KQ decreasing with increasing of J and η0 achieves maximum at J = 1.4.
The following pictures show velocity and pressure distribution around the propeller for J = 0.6 and 1.2 at the center cross section in the side and front planes for the scaled model (Figures 6, 7).
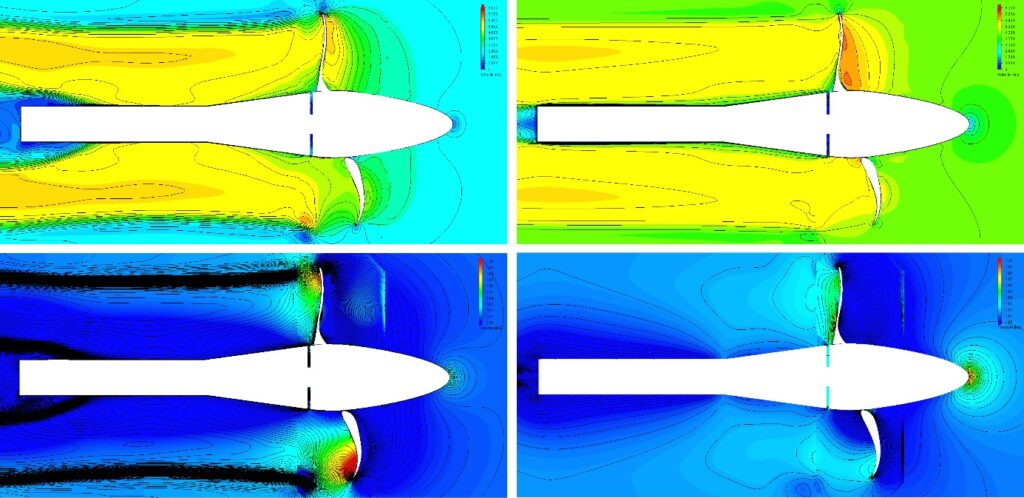
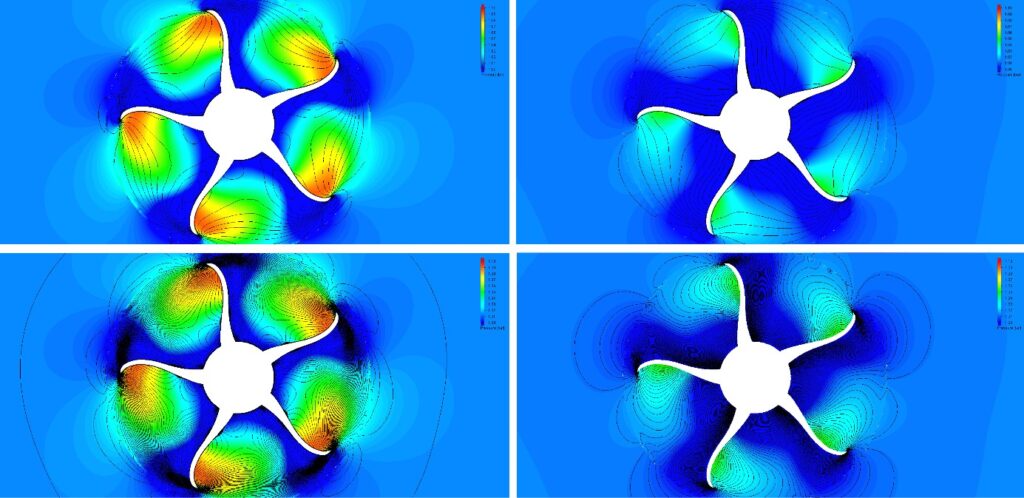
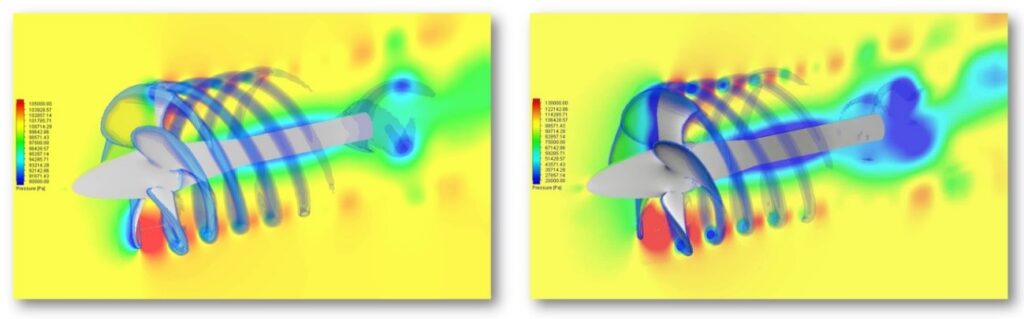
Figure 8 shows pressure distribution at the central cross section and iso-surfaces of vorticity for the scaled (angular velocity is 15 1/s) and the full (angular velocity is 4.33 1/s) models.
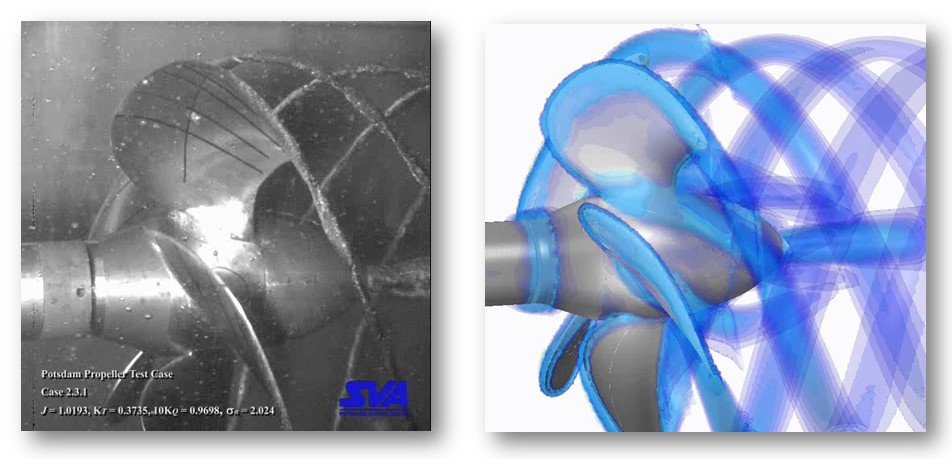
SVA also published experimental data of the cavitation regime for the scaled model in terms of thrust coefficient and Simcenter FLOEFD results of this complicated phenomena was compared with the measurements. The case with J = 1.019 and cavitation number (σn) = 2.024 is considered. For this test, the rate of revolutions is 24.987 1/s.
The comparison between Simcenter FLOEFD predictions and experimental data is shown in Table 5, Figure 9 and 10. It should be noted that they are comparable.
| J | σn | KT | |
| Simcenter FLOEFD | 1.019 | 2.024 | 0.3703 |
| Experiment | 1.019 | 2.024 | 0.3725 |
| Error, % | – | – | 0.6 |
Conclusion
In conclusion, this study demonstrates the ability of Simcenter FLOEFD to solve these kinds of applications for marine propellers and to find not only characteristics for the open water tests but for cavitation regimes as well. The ability to conduct these types of studies within their preferable CAD system is a great benefit for design engineers who want to optimize the propeller performance during the early stages of design.