Is e-bike noise an issue? Quit whining!

Spring is here and summer is coming! So after spending (part of) my winter holidays analyzing the vibrations on a snowboard (and proving why it’s better than skiing, check here!), I’ve decided to take out my e-bike for a ride. Another good reason to do so, is the fact that today – June 3 – is World Bicycle Day.
E-bike sounds
E-bikes are becoming more and more popular these days, and a lot of different brands exist. An important criterium for end users is their operating range. But also the e-bike noise is an important aspect for both manufacturers and end users.
When talking about “noise”, I do not only mean the decibel (dB) value of the overall noise level. This dB value is something you typically measure with a sound level meter or via an ISO sound power test. I wanted to get a better understanding of the acoustic quality comfort that e-bike riders experience.
So I took my backpack and the Simcenter SCADAS XS with its binaural headset to record some sounds. As the measurements took place outside, I added the windcaps to protect the built-in microphones from disturbing wind turbulent noise.
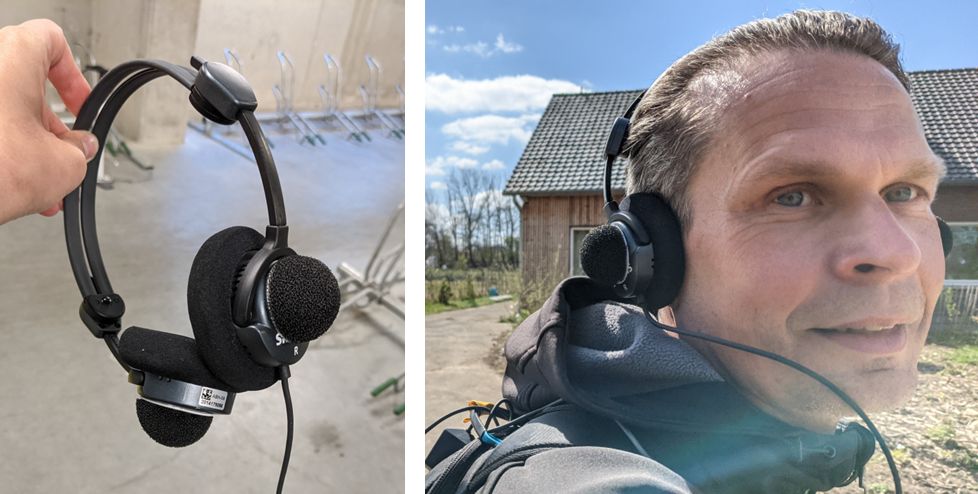
Since the SCADAS XS has an additional 12 channels available, I decided to take it a step further and instrument the e-bike with more sensors. After all, why not?
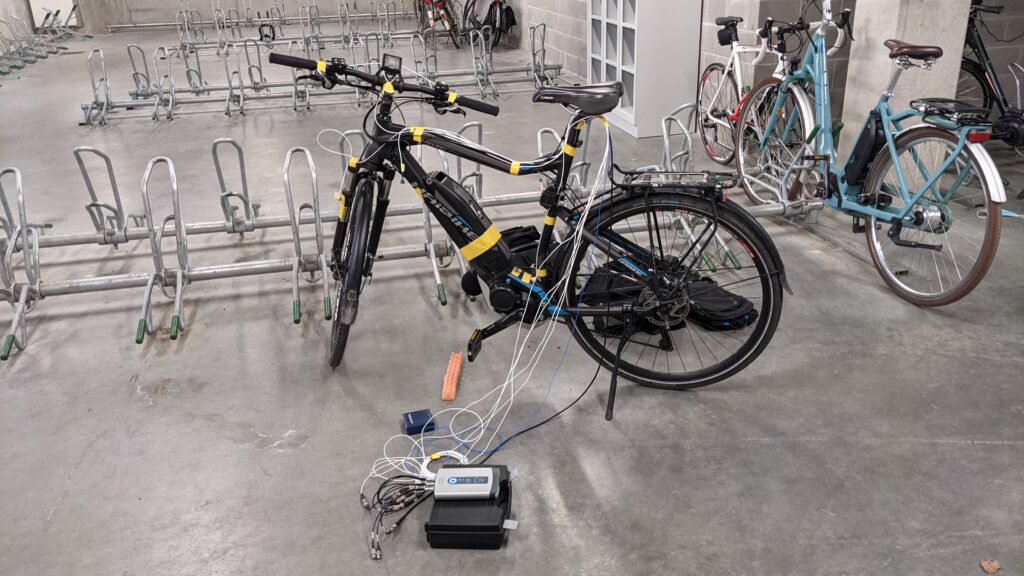
Instrumenting the e-bike
Next to the binaural headset, i added the following sensors:
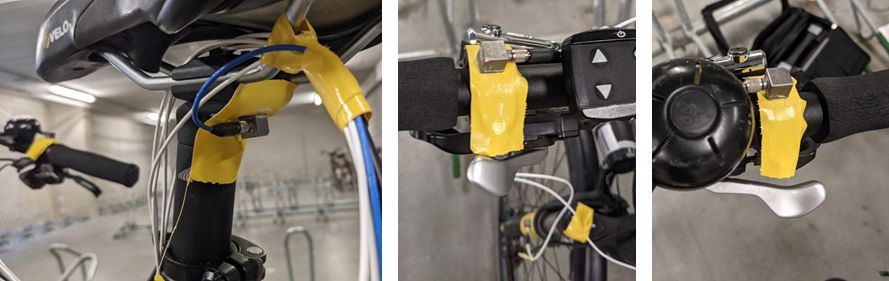
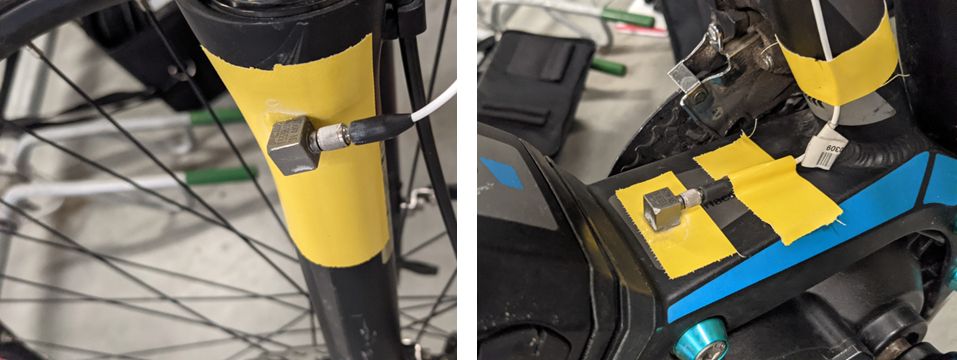
- 7 accelerometers at different locations on the e-bike: handle bars, suspension, saddle and frame
- An extra microphone with windscreen close to the electric motor
- GPS signal for speed, position and altitude
- GoPro camera to document where i was riding
All of this sensor information allows me to not only look at the sound (quality) aspect of e-bike, but also to analyze its vibration behavior. How will the suspension perform on different road surfaces? Will the bike frame deform a lot? And how about the ride comfort at both the handle bars and the saddle.
Once all the cables were safely taped to the bicycle frame, it was a matter of seconds to plug-in the different sensors to the SCADAS XS, push the “Read TEDS” button to get all the sensor settings and to put the pocket-sized XS in my backpack and pedal away.
The e-bike test ride
Rather than planning very strict measurement scenarios, I decided to take advantage of the great weather and simply ride around. As this is the “real-life” usage of the e-bike, it covers many different user scenarios. It includes cycling on different road surfaces: Belgian blocks (cobblestones), asphalt road, gravel, etc. to focus on the vibrations, deformation and ride comfort. Going uphill and downhill reveals the effect of different loads on the electric motor.
Just before starting each measurement, I quickly checked all sensors and signals via the wirelessly connected tablet.
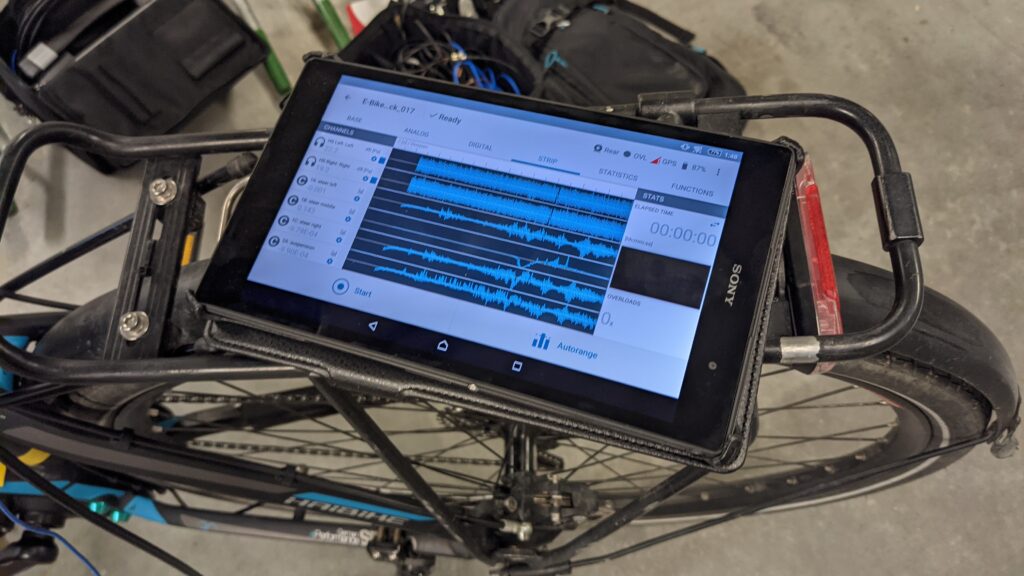
Once that was OK, a single push of the button starts the measurement. All data from all sensors is securely saved on the internal memory card inside the SCADAS XS. The internal battery of the SCADAS XS allows me to take measurements for a full day in full confidence. The only thing I needed to do is push the pedals (with a little help from the electric motor).
What can you do with all this data?
As I measured a mix of different sensors, a lot of data is available that gives detailed insight into the dynamic behavior of the e-bike in both the sound and vibration domain.
As a first step, simply visualizing and replaying the time data in the Testlab Neo Desktop shows the correlation between certain events and signals. Selecting the sensors in the pivot table automatically adds the corresponding signals in the appropriate displays in a nice full-screen layout. How intuitive can it be!
Notice that you cannot only select time signals from the individual sensors, but also combine it with the video data from the GoPro or GPS data that is automatically visualized in Google Maps. You can zoom in to specific segments, look at the frequency content and filter away certain annoying sounds during replay.
Vibration comfort is a big deal
The measured vibrations can be used to visualize frame and suspension deformations and also to quantify the ride comfort using ISO human body vibration standards. Some examples are shown below:
- Using the measured vibrations on the bicycle frame
- time domain animation
- operational modal analysis
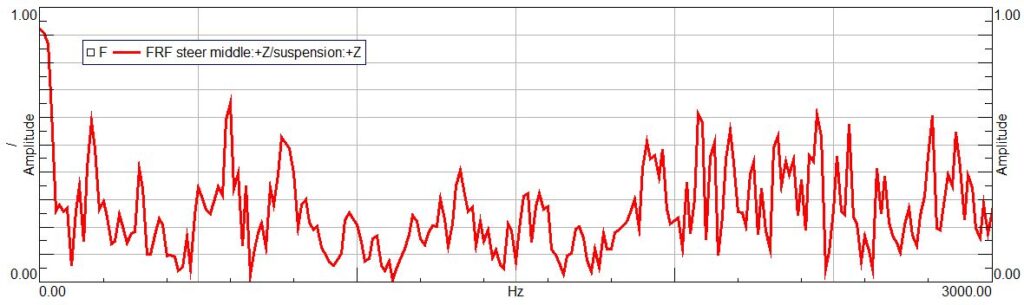
- Using the measured vibrations on the front suspension
- time domain animation
- operational deflection shapes
- characterizing the damping efficiency of the suspension as a function of frequency
- Evaluation of the ride comfort (based on ISO2631 human body vibration filters)
- handlebar vibrations for hand-arm vibrational comfort
- saddle vibration for whole-body vibrational comfort
- comparing the ride comfort on different road surfaces
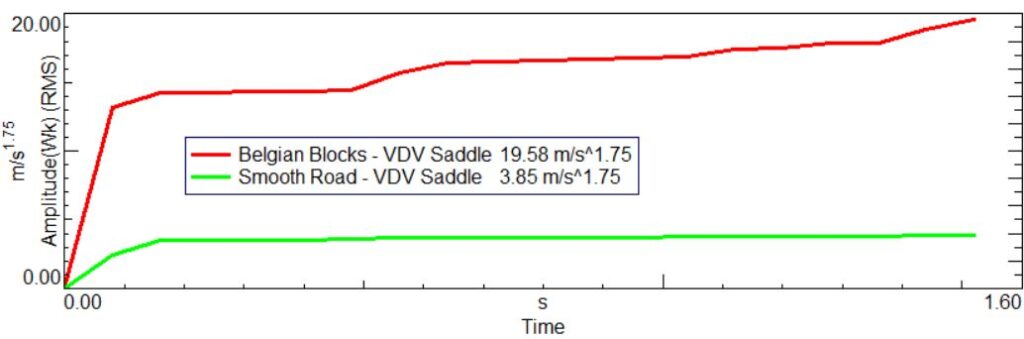
It is clear that riding on Belgian Blocks is way less comfortable than riding on a smooth road. Both the animation as well as the ISO standardized VDV values further quantify and confirm this.
But does the e-bike sound right?
We’ve covered the vibration aspect of the ride comfort, so let’s now have a look at the e-bike noise (dis)comfort.
I compared the acoustic signals measured at the driver ear position between driving on a smooth road and on Belgian blocks. Living in Belgium, i can assure you that these cobblestone paths are quite popular around here.
Next to replaying the sounds and filtering away annoying noises during replay, further processing can be done on the sounds. I used some popular sound quality metrics such as Articulation Index, Prominence Ratio and Time Varying Loudness. For completeness, i also added traditional SPL and Spectrum analysis.
As expected, the noise caused by the (very) uneven road surface is masking the electric motor whine. Despite the prominence ratio for the smooth road measurement is 2 dB higher, all the other metrics report that the cobblestone road has a very negative impact on my acoustic comfort. So, while the motor whine is still present, it’s not strong enough to be perceived.
I will let you in on a secret though. Exterior acoustic measurements without a dedicated, and preferably secluded track can be quite challenging. That’s especially important when dealing with low noise sources, such as electric motors. I’ve mentioned at the beginning that this was a nice spring day. Unfortunately, I was not the only one enjoying the good weather.
That is why, for a detailed sound quality evaluation, I’ve decided to conduct additional measurements inside.
Which e-bike sounds best?
I asked some of my colleagues to bring their e-bikes to the office, so we could benchmark different models. In total 4 e-bikes were tested, 3 of which accidentally had the same brand of an electric motor, but differently integrated.
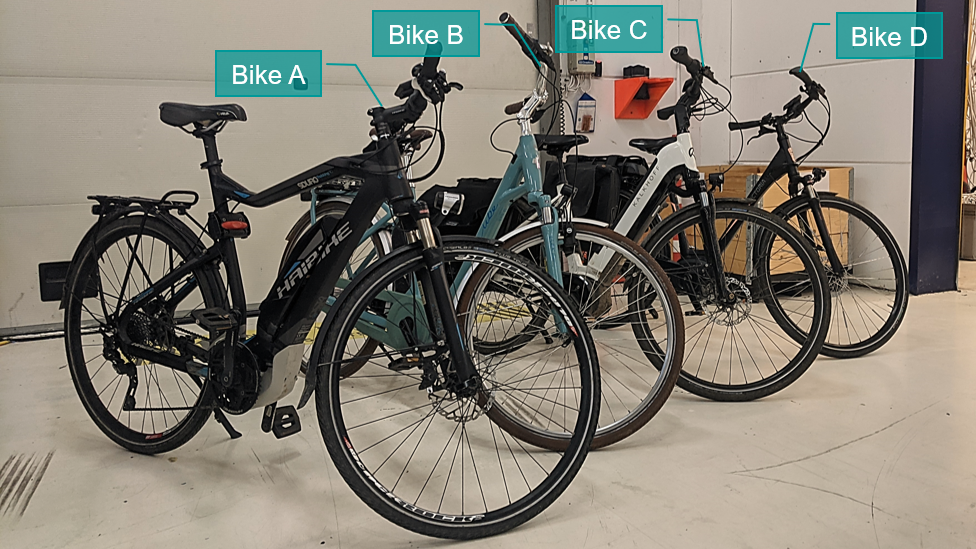
Let’s first compare the sounds from the 4 e-bikes:
We see (and hear) some clear differences in the measured sound pressure levels, but Bike D has some unusually strong high-frequency content. Let’s have a closer look.
Using the interactive audio filtering quickly reveals the issue. It seems that the owner of Bike D is suffering from a very prominent brake squeal noise, with peak amplitudes around 12.500 Hz. Can’t hear it? It might be linked to your age. High frequency hearing loss is unfortunately very popular once you hit 50. In order to make a fairer comparison, let’s filter this frequency out and listen to the effect on the sound quality of Bike D:
Removing the brake squeal noise helped to obtain a more representative sound sample. While level metrics such as loudness, articulation index or sharpness were not strongly affected, we do see the effect as a 15 (!) dB drop in the prominence ratio. That’s quite a fix.
Below are the filtered e-bike sounds:
Bike B and C seem to have very similar sound quality performance. With high articulation index values, prominence ratio at around 7.5 dB and 9 sones of loudness, both e-bikes can be considered very silent and pleasant sounding. Bikes A and D, on the other hand, affect speech intelligibility and result in higher loudness and tonality levels. Bike A especially might be considered as most unpleasant.
Do real cyclists agree with those metrics?
The last step of a sound quality analysis process is to conduct a subjective listening test. Jury Testing collects subjective feedback from a group of listeners in order to understand their preference towards one sound or another. This is extremely helpful when benchmarking competitive products, designing new sound quality targets (e.g. how much loudness is too much?) or trying to create combined sound quality metrics that represent a certain product feature (pleasantness, robustness, sportiveness, etc.).
Here’s an example of a typical listening test on our e-bike sound samples:
Each time, a randomly created pair of sounds is played to the juror. The scale of 5 buttons allows to select the preferred e-bike sound when asking: “Which of these e-bikes would you take on a long ride?”. This type of test (called the Sheffe’s method) gives more freedom when answering since the scale has 5 options:
- Definitely A
- Rather A than B
- Both would be OK
- Rather B than A
- Definitely B
The same question is asked for the next pairs of e-bike sounds. At the end of the listening test, a preference list shows the ranking of the different e-bikes from most to least preferred. Other methods available in jury testing are A-B comparison, semantic differential, ranking or category judgment.
The final step is to verify that the (objective) sound quality metrics (or their combinations) correlate with the (subjective) preference as given by the jurors.
Great things come in small packages: the Simcenter SCADAS XS
Isn’t it amazing how many different types of analysis you can do, simply using the measurements we did using the hand-held Simcenter SCADAS XS? That’s what we call measurement power: maximal testing flexibility using our pocket-size sound and vibration analyzer.

Want to know how professionals in the bike industry use our testing products ? Checkout the stories on TREK and SRAM.
Or watch this on-demand webinar on “Leverage testing performance using a compact test data acquisition system, Simcenter SCADAS XS“.


