Using Drive Cycles in Motor Design Software
A vehicle’s range, emission level, gradeability, acceleration time and other parameters under realistic conditions can be tested by drive cycles. For traction motors in xEVs the test results are a measure of their performance with respect to efficiency, reliability, adherence to environmental standards and other metrics. Because of this a recent trend has been to develop new approaches for incorporating realistic drive conditions, and hence using drive cycles in motor design software, to follow the V-cycle of the design process to discover better designs. When we combine these approaches with simulations utilizing High Performance Computations (HPC), it leads to better designs faster!
The typical motor design V-cycle consists of: machine performance determination, design initialization and iterations, detailed analysis and optimization are not modified by the inclusion of drive cycles into the process. What is important is to improve design outcome by exploring how their effects may be used at various stages.
Motor performance and design initialization
The first step of a traction motor design V-cycle is to determine the required torque output and speed ranges. For a given drive train configuration and vehicle speed, we can calculate these using a number of system level parameters such as the vehicle weight, tire dimensions, chassis characteristics, material properties and the vehicle performance parameters.
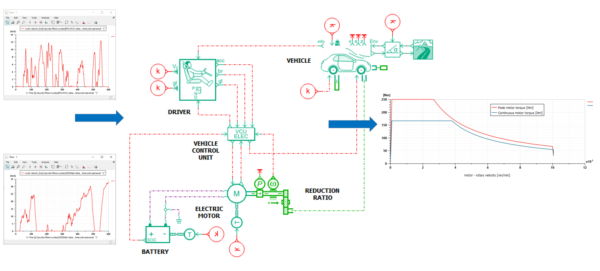
To clarify, a drive cycle is essentially a table of vehicle speeds versus time. So a system level model of the vehicle can use drive cycles as an input. The simulation outputs would include the required torque and the speed ranges of the traction motor. Depending on the application, the sum of torque and speed requirement ranges can be calculated using multiple drive cycles. See Figure 1 for an example using Simcenter Amesim.
Set motor performance targets:
- the torque vs. speed characteristics of the motor (obtained from system level simulations)
- the minimum required efficiency
- constraints related to the battery size
- the cooling and drive systems
- the available physical space
We use these to initiate the design process and consider a number of design candidates. For any candidate(s) steps are taken to select the topology, the stator and rotor sizes, lamination and magnet (if applicable) materials, winding configuration including the number of turns, etc. This is the primary design stage.
At this stage we are concerned with making realistic choices to reach the design objectives. Drive cycles may affect some of the design choices during the primary stage. However their impact is better incorporated once an approximate design which satisfies all the design objectives is achieved. Assuming this is the case we can take two steps.
Motor design software: iterations using drive cycles
First, we compute the total loss in the machine for the most important drive cycles. Typically, reusing the same drive cycles to determine the performance requirements. Design changes are made to reduce the losses, and hence, improve the efficiency. Second, the most significant load points are identified. A multi-objective design optimization uses these. The goal is to improve the machine performance with respect to multiple design objectives.
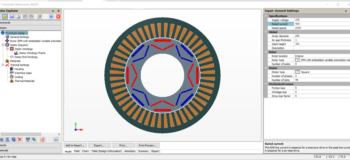
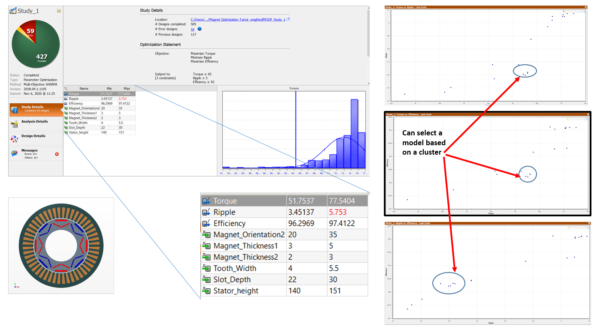
Let’s see an example (Figure 2, using Simcenter Motorsolve, a motor design software) for an 8 pole-48 slot interior permanent magnet (IPM) machine that is similar to that used in the NISSAN LEAF electric vehicle.
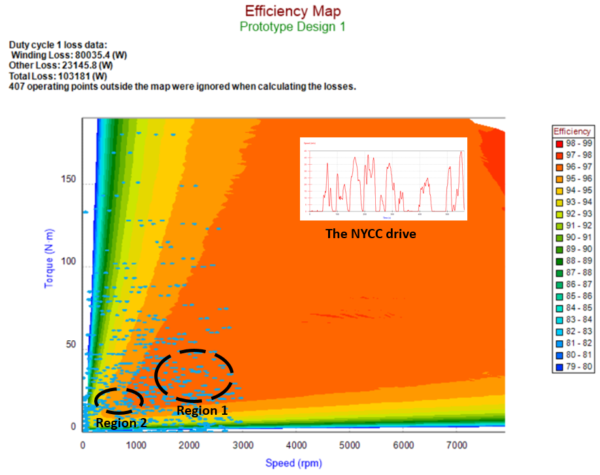
The first thing to note in Figure 2 is the winding and other losses (the sum of hysteresis and eddy current losses) reported for this drive cycle (top left corner), in this case, the New York City Cycle (NYCC). Having access to these results at this stage of design provide an excellent opportunity to make changes to reduce the losses in the machine, such as modifying:
- the machine geometry
- the permanent magnet dimension
- the winding configurations
- or any other parameter to improve the machine efficiency
Optimization using drive cycles
We can make further design improvements. So let’s reconsider Figure 2 and look at the two separate regions of operating points identified by the ovals. These two regions represent the most significant collection of load points for the NYCC drive cycle, on the basis of total energy losses and the amount of time spent by the machine. A k-means clustering algorithm (or another method of choice) identifies the regions. The centroids of each region are calculated to obtain a load point that is the time and loss weighted average over all the points for a region.
We optimize some aspects of the machine shape at the load points corresponding to the centroids. That is to say, we have carried out a simple multi-objective optimization and looked at the Pareto fronts with respect to the output torque, the torque ripple and the efficiency for region 1.Figure 3 shows the results. From the Pareto fronts a design is selected for the next and final step of the design process.
Detailed analysis, design validation and HPC
The first two design stages of the V-cycle incorporate the effects of drive cycles. To complete the process we need to carry out design validation, system fault analysis, demagnetization prediction and more. This is the detailed design stage during which the highest accuracy computational methods may be needed. This means using 2.5D/3D Finite Element Analysis (FEA) based calculations. It may take hours to days, or even weeks of computations for any needed 3D simulations. How can we shorten that?
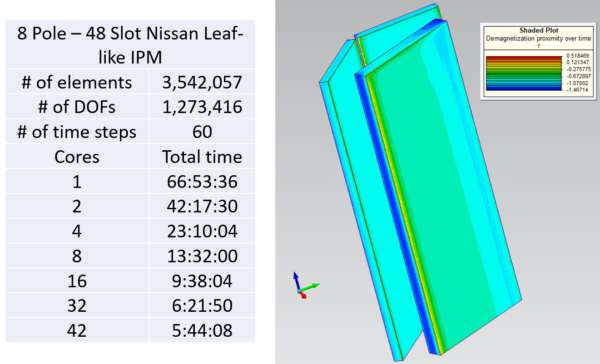
Using High Performance Computing (HPC) capabilities may significantly reduce analysis times. As an example, we apply Simcenter MAGNET 2020.2’s newly added HPC capability on the 3D model of the design selected from the previous step. In this case, coupled electromechanical transient simulations have been carried out to validate the output power of the motor and to identify if the permanent magnets are susceptible to demagnetization during peak power operation.
We have used an Azure cluster for the simulations. Figure 4 shows the results. The scaling of simulation times with the number of cores show more than 10x speed up. This means reducing the simulation times from several days to a few hours. The demagnetization results are based on 3D modeling of irreversible (de)magnetizing behavior of permanent magnets.
What do these mean for my design process?
We presented a few examples of a number of important machine performance related results and methodologies for design improvements. Let’s summarize:
- Two of the three main design stages have used drive cycles. First, the determination of motor performance requirements. Second, during primary design to reduce the losses in the machine and to carry out multi objective optimization. The optimization was carried out with a load point derived from the machine drive cycle.
- An important calculation during the final design stage is the 3D demagnetization proximity prediction results. To speed up the simulation time, the newly added HPC capabilities of Simcenter MAGNET 2020.2 was used to determine the 3D demagnetization proximity prediction.
Now, let’s consider the simulation times of the V-cycle, ~10’s of seconds during machine performance determination, ~10’s of seconds to minutes during primary design, ~hours for multi-objective optimization and ~hours during design validation (using HPC). All possible to do in a single day. This is tremendous considering the level of details, accuracy and realistic behavior based approach that has been used in this example.
To sum up, we discussed how to incorporate drive cycles into the electromagnetic design of a motor. But what about the cooling system design? Or similarly, accounting for an integrated motor-drive design? Or for instance, the noise and vibration related aspects? These aspects, which make up the complete design story, are part of an upcoming webinar on December 8th, 2020. Please register today if you would like to know more on how all of these aspects come together.