Stop developing your cars in Excel

We all know Microsoft Excel and work with colormaps, spectra, time series, but in the end it’s often about Key Performance Indicators – the KPI’s. The majority of companies have their own procedures to reduce GBs of test data into a couple of statistics, such as an RMS value from an Octave section, or a peak value from a spectrum. Interestingly, these are often calculated in office type of environments, such as Microsoft Excel.
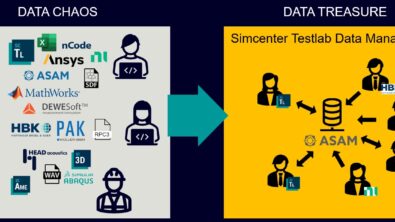
Now do not get us wrong, there is nothing bad about such type of workflows. The only challenge that we see, is that over time it may become difficult to store, maintain and find these reports back without a relational database in place, and data management in Simcenter Testlab can help
Minimize the workload – frontload annotation
The first step in centralizing your data is with annotation. You can’t store years of data in a single location if you cannot distinguish it from each other. Whether you decide to annotate before, during or after data acquisition, the information always travels with the data.
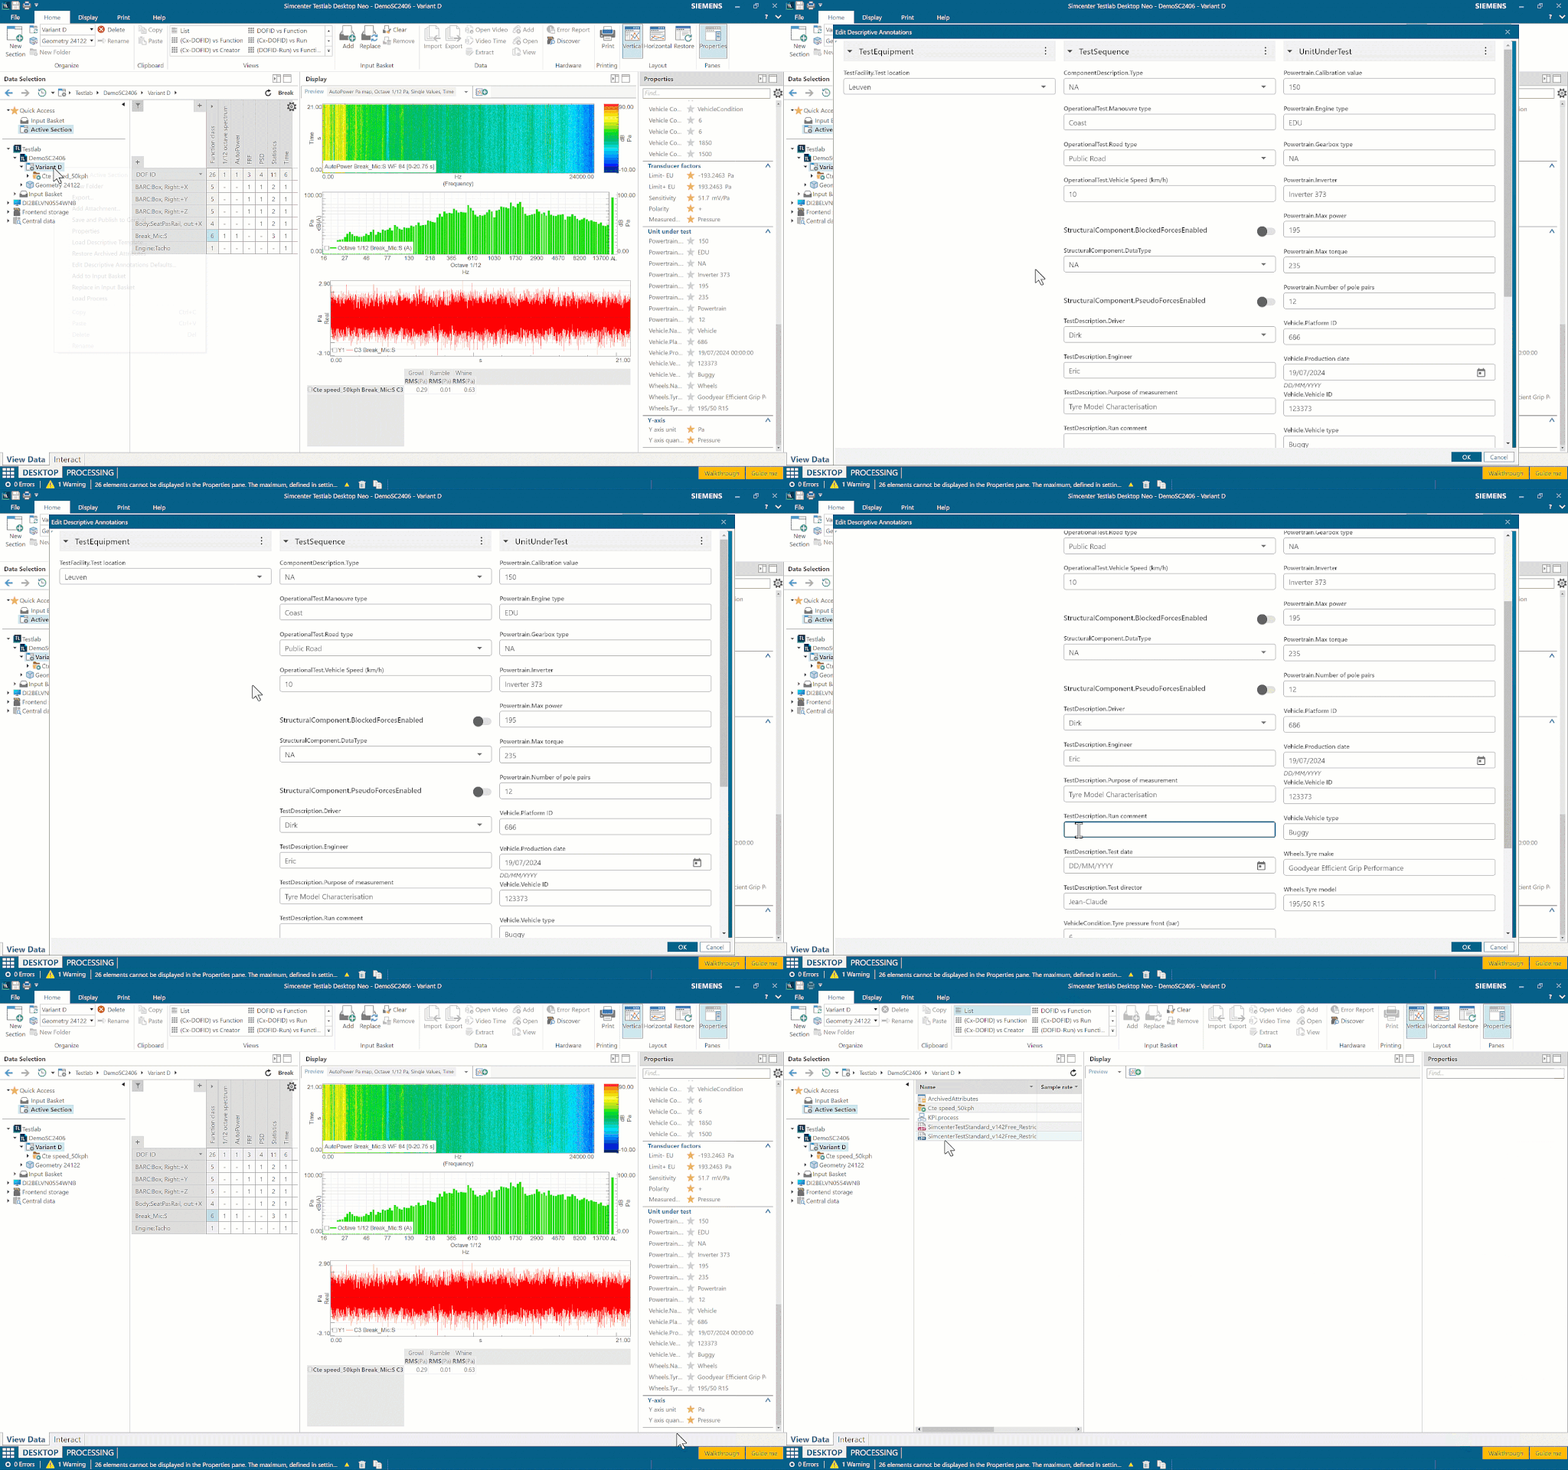
In the example below you can see the first improvement of Descriptive Annotation in Simcenter Testlab 2406. You can now decide if the colleagues performing the measurements can only select values from a restricted list or add new values while annotating.
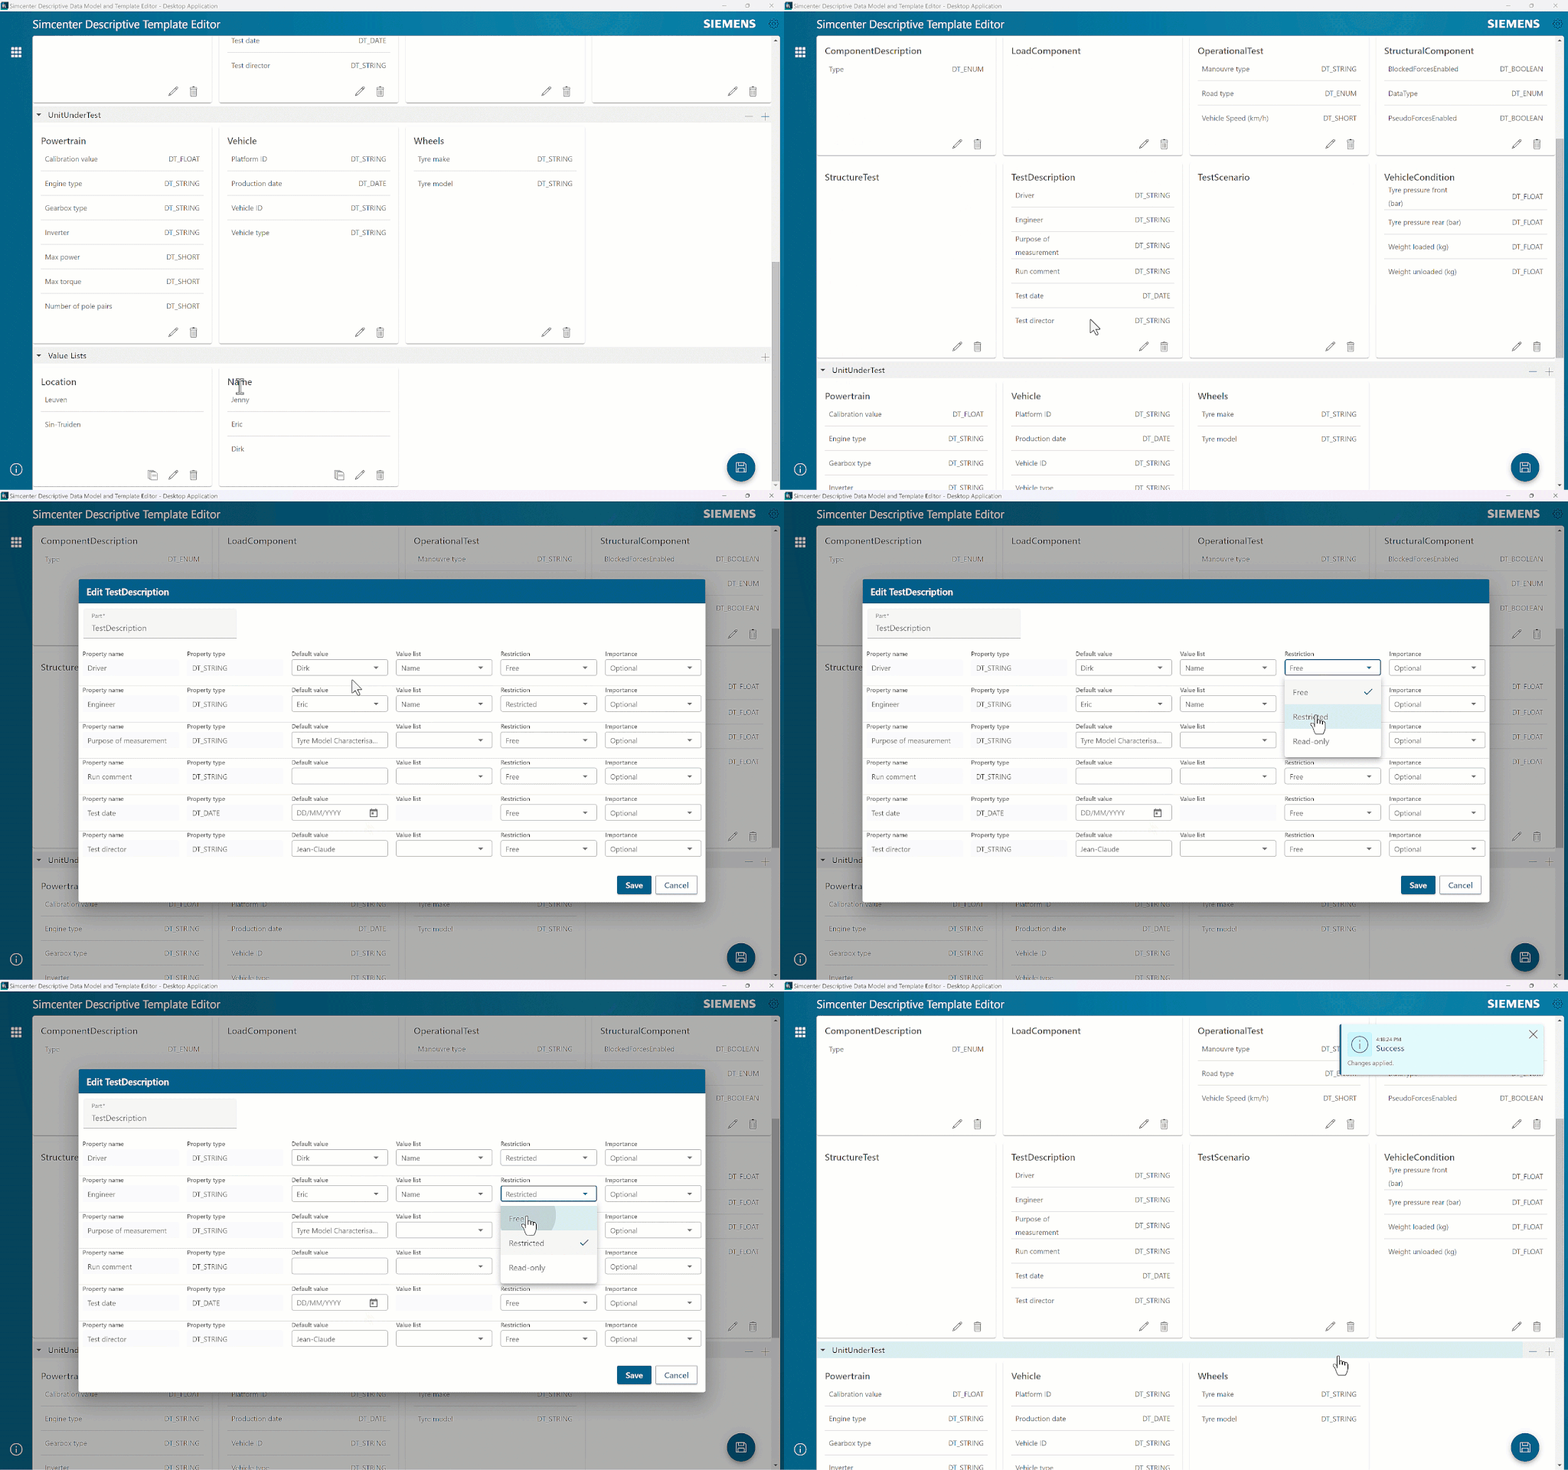
In an ideal situation, 99% of the information you are going to have to annotate is known before the test. Tire model, component variant or the name of the requesting engineer are of course important information, but it would be a waste of time to ask the Test Engineer or the Operator to fill them in. Instead, prepare the Descriptive Annotation Template upfront and let the engineers or operators focus on what they do best: testing.
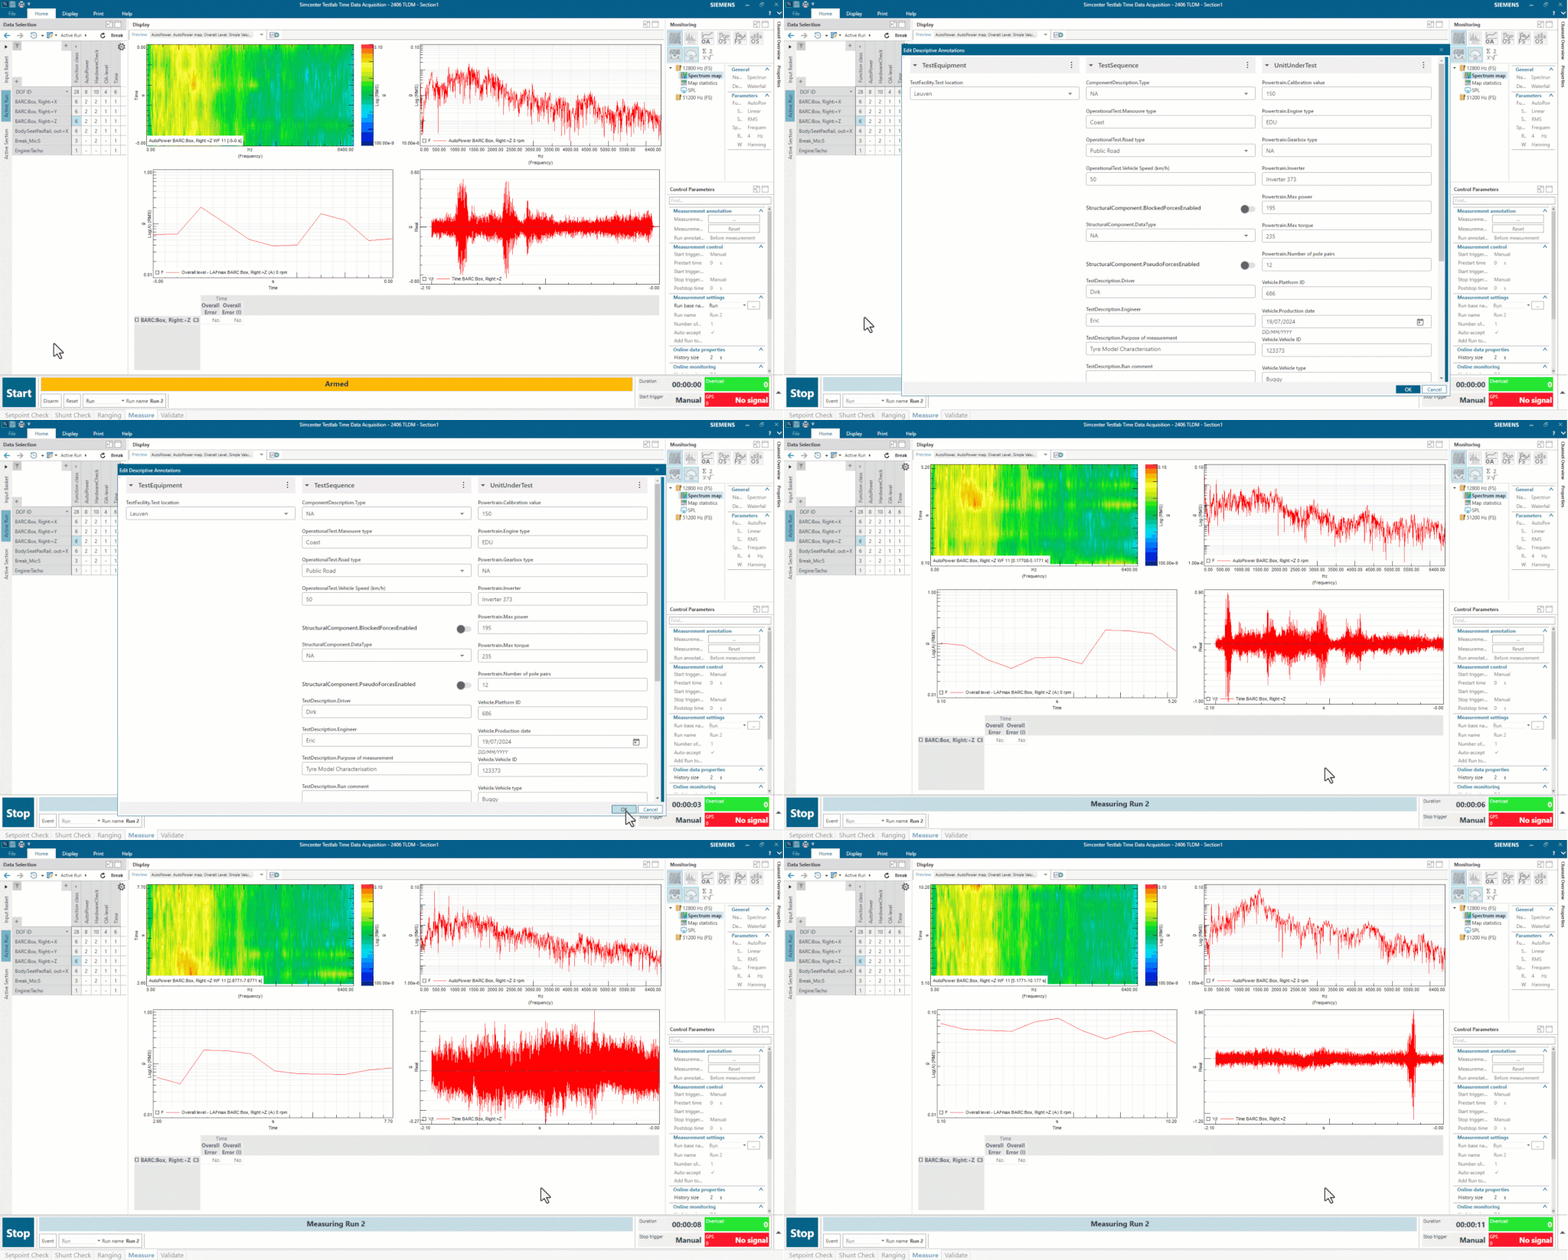
These templates can be enriched with defaults and values lists, such that majority of the information is already available.
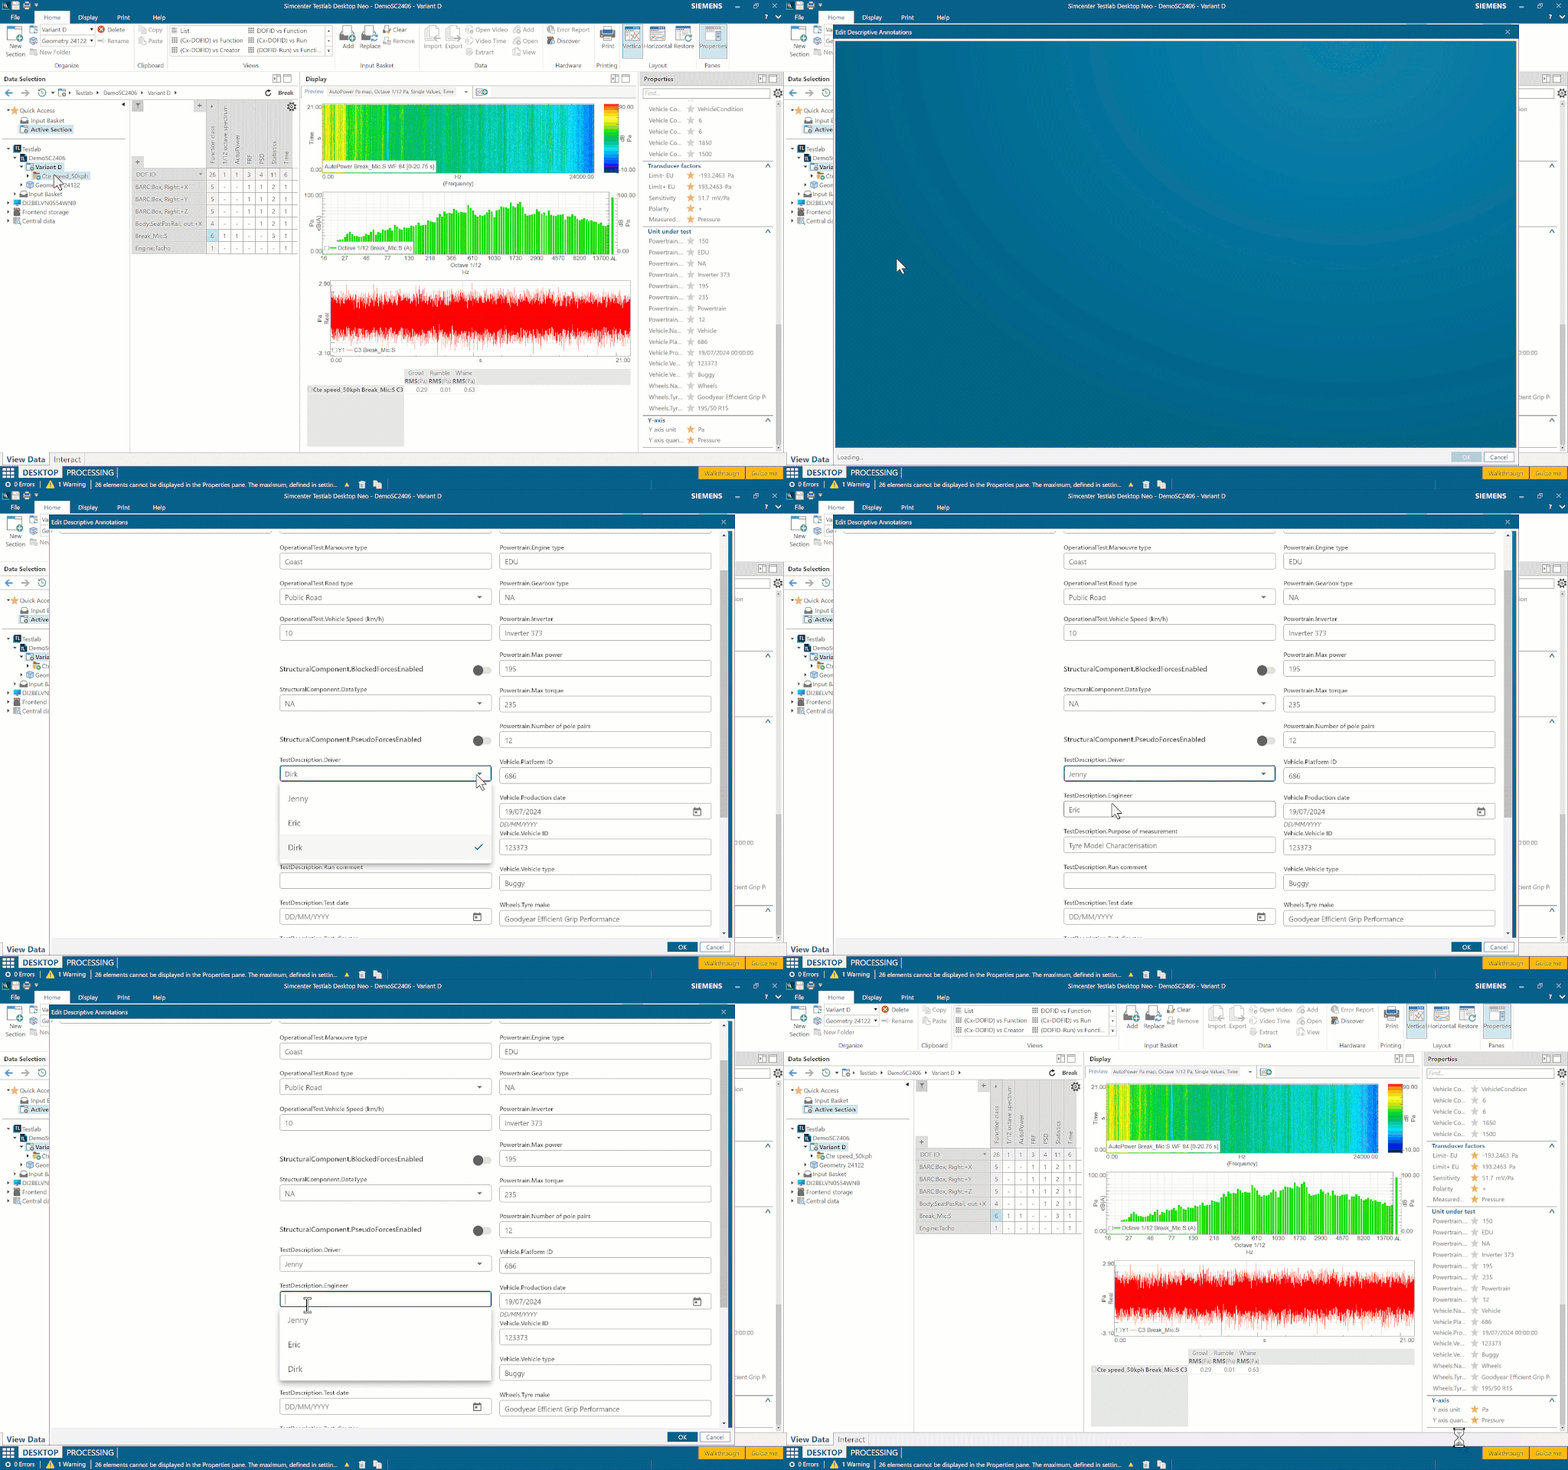
The engineers or operators themselves can now change or add extra defaults directly in the software, which will be then kept for all runs that follow.
How to get your KPIs, no Excel needed
The data is measured and annotated, great job! But how do you boil it down to a couple of single values, which can tell you if your prototype performs as expected? This one is easy, the answer is not Excel, but Simcenter Testlab Process Designer.
For the sake of the example, we will assume that the three KPIs that we will be comparing are RMS values taken on limited 12th octave bands:

Let’s create a process together that will extract those interior noise KPIs from a road noise test. We will start by calculating the peak 1/12th octaves and extracting the three segments (55 Hz – 163 Hz: Rumble, 307 Hz – 610 Hz: Growl, 870 Hz – 2180 Hz: Whine) by using the Extract segments (block) method.

Since we need the RMS values from different frequency ranges, we are going to use 3 copies of this method. We will follow with a Metadata editing, to make sure that each segment is annotated with the actual KPI name.

The final step is simple – connect the Statistics method and calculate an RMS value on each of the frequency segments. Et voilà, we have KPI’s, no spreadsheets needed.

Let’s not forget about annotation – we’ve done all this work to make sure that our data is properly annotated. This information can be now used to immediately distinguish the different measured variants. In the example above we’ve replaced the traditional section names with something much more interesting – the tire make. Easy visualization of the results next to contextual information if something that Simcenter Testlab offers out of the box, while making such comparisons in a spreadsheet takes quite some skill.
Publishing, where the magic happens
Instrumentation? Done. Annotation? Done. Processing? Done! Time to save the results on a shared network drive and call it a day, right? This is indeed how many R&D companies are working, but there is a catch. Either you keep a very strict naming convention regime and make sure everyone adheres to it, or you risk not being able to find your calculated KPIs saved in an Excel file months from now… tricky, isn’t it?
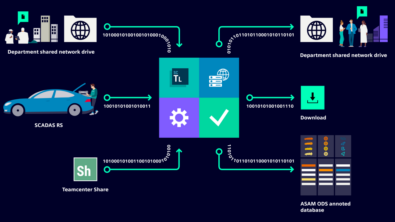
Therefore, it might be interesting to consider a centralized open-standard database, such as Simcenter Testlab Data Management. In such an ASAM database, all data is centrally store but also indexed for fast and easy retrieval across projects and sites. Since Simcenter Testlab Data Management is directly integrated within Testlab, you can publish your results with a few clicks:

Once published, it is very easy to find your results back and visualize them in a display, as if they were still stored on your own drive.
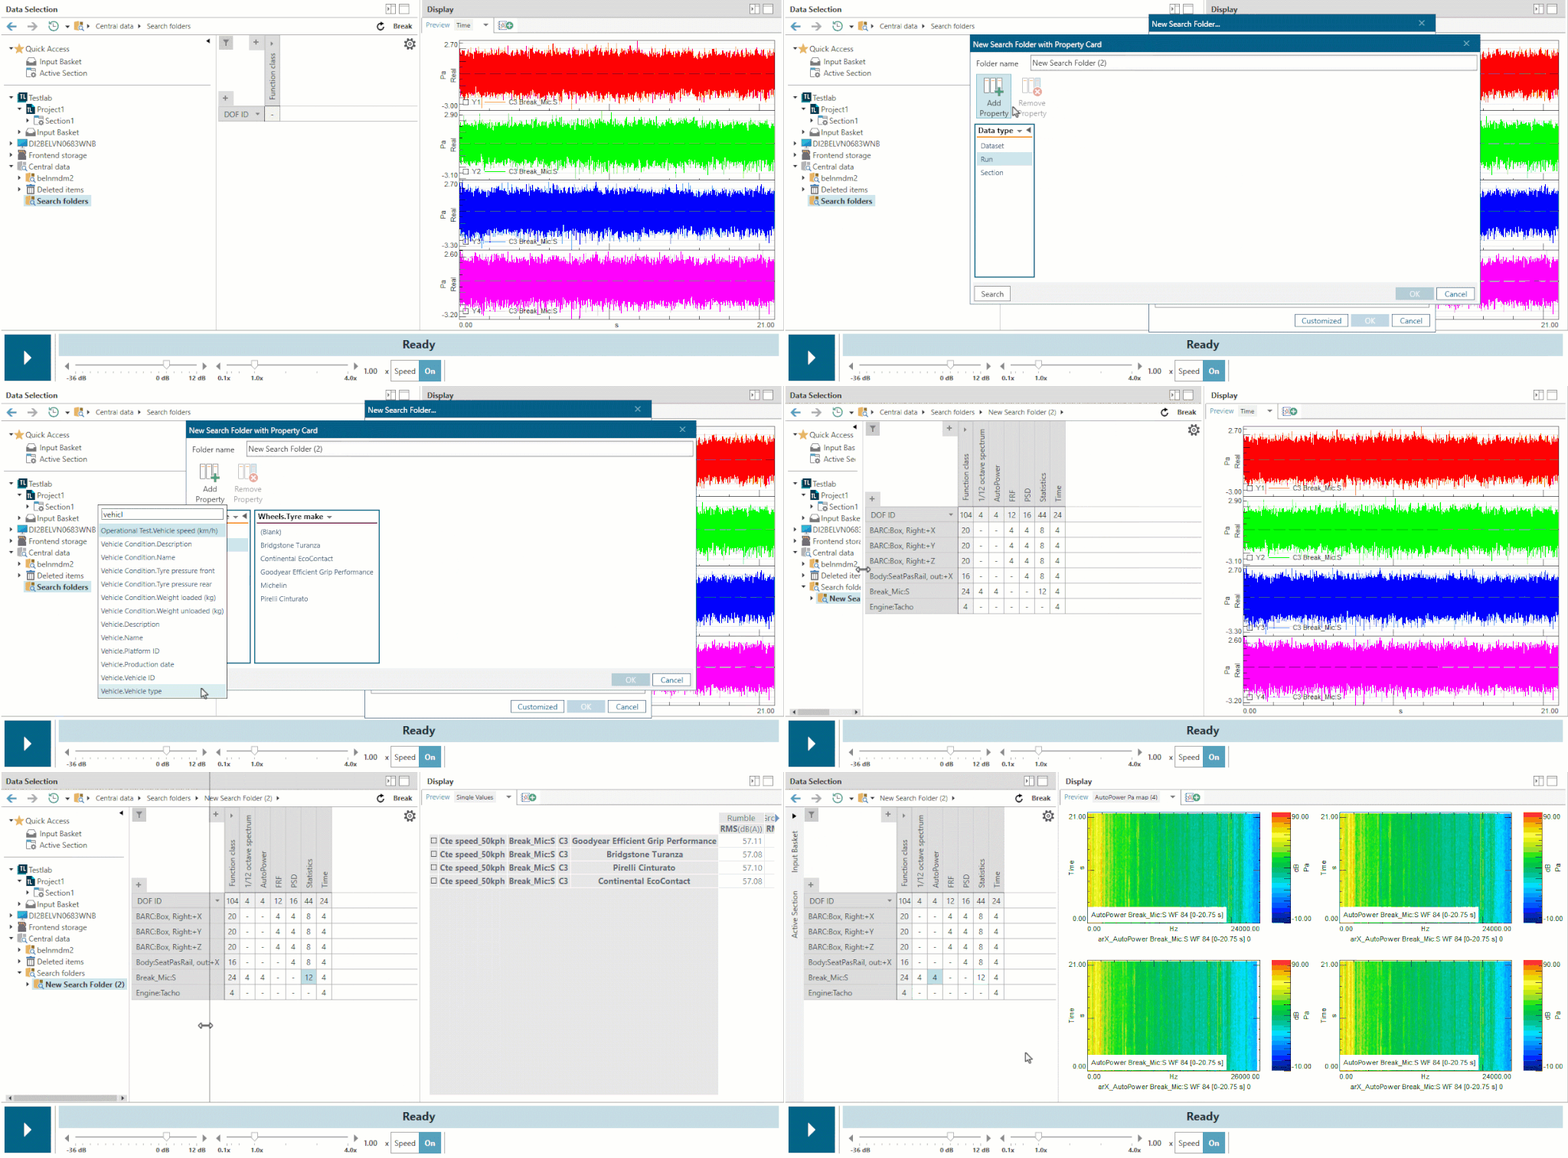
Notice how we do not even have to know when the measurement was taken? All it took is to know what we wanted to find – the vehicle description and tires. The second extension for Simcenter Testlab Data Management is linked to a very much appreciated feature of Testlab Neo: audio replay. You can now replay the centrally stored data without the need to download the results first. Neat, isn’t it?
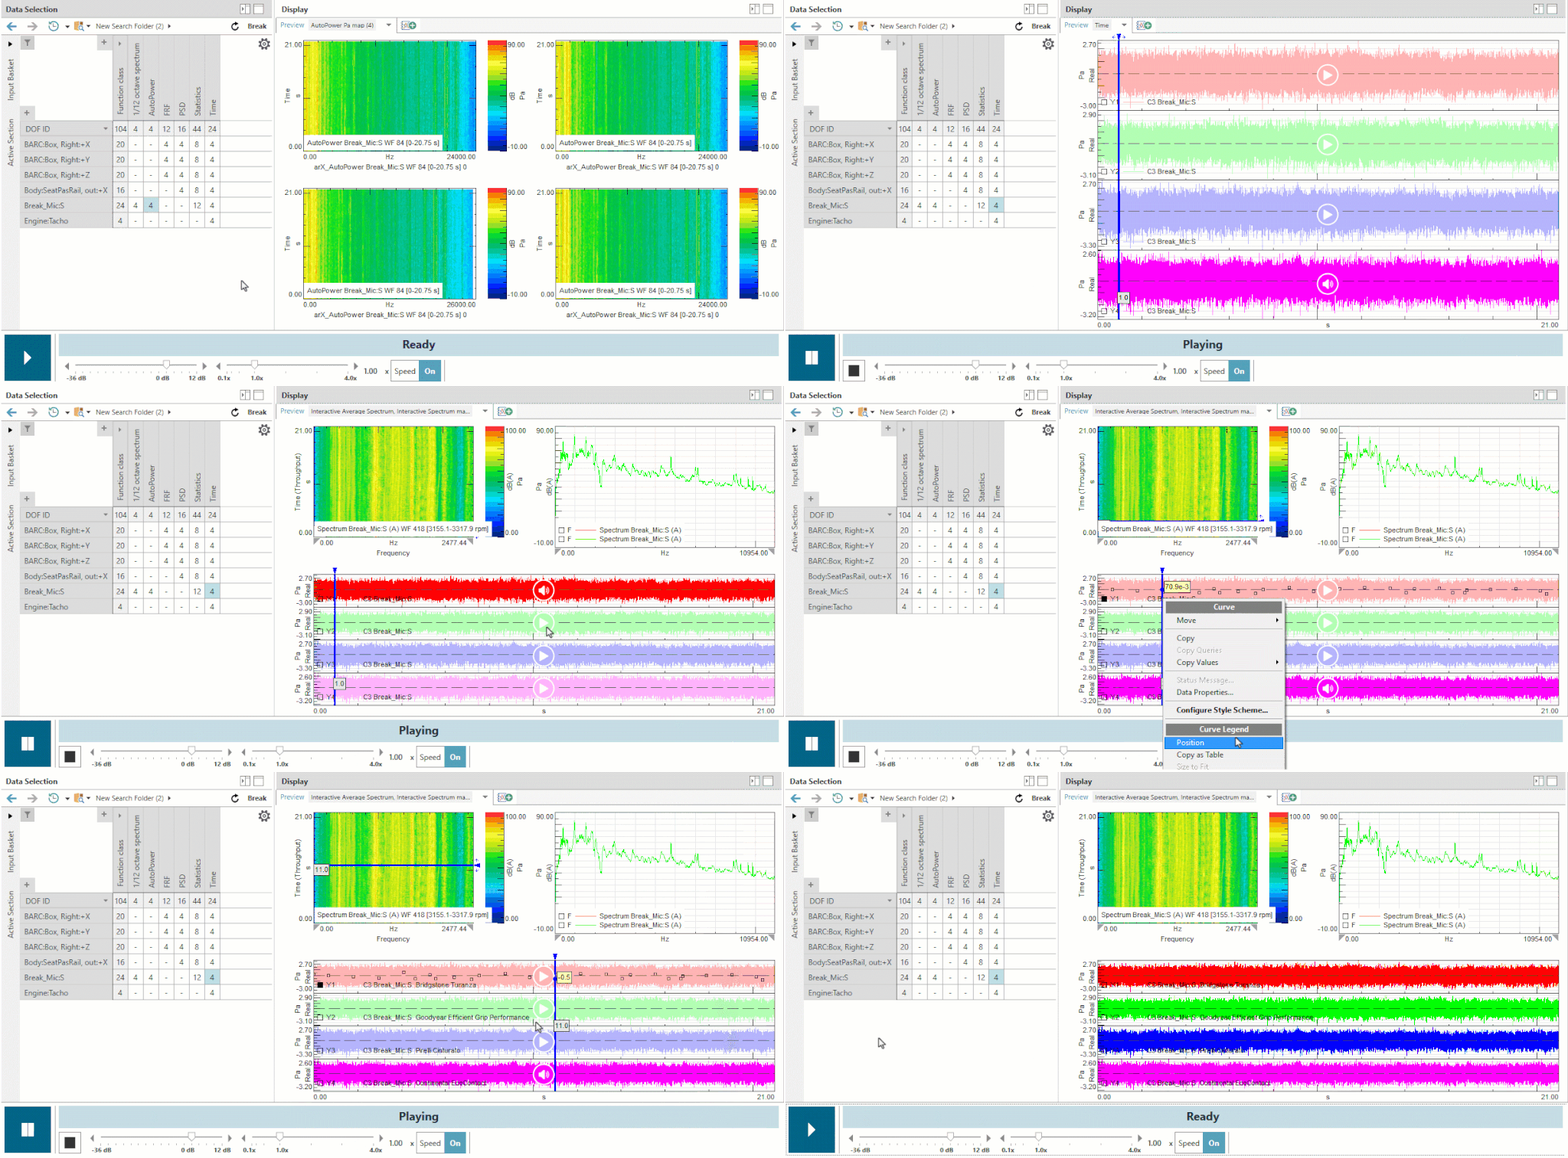
All the great features of Neo Audio replay, such as filtering or instantaneous spectrum content visualization are also supported, again, as if your data was right there on your hard drive.
Smarter and easier, what about faster?
Storing your KPIs in a centralized open-standard database has tremendous advantages for engineers, especially those with access to the Simcenter Testlab Desktop. But what about sharing those results further? Excel does have one advantage – you can be sure that every Manager that you’re supposed to report to has it installed on his or her system. But worry not, Simcenter Testlab can help you to create clean and informative Microsoft Office reports as well!
The final group of extensions is linked to reporting. Simcenter Testlab 2406 has been extended with the ability to generate and print multi-page reports, both results and annotation included very easily and quickly. Firstly create your reports, including queries and use the Curve Scrolling mechanism to preview your report (here again we’re using the annotation rather than section or run names):
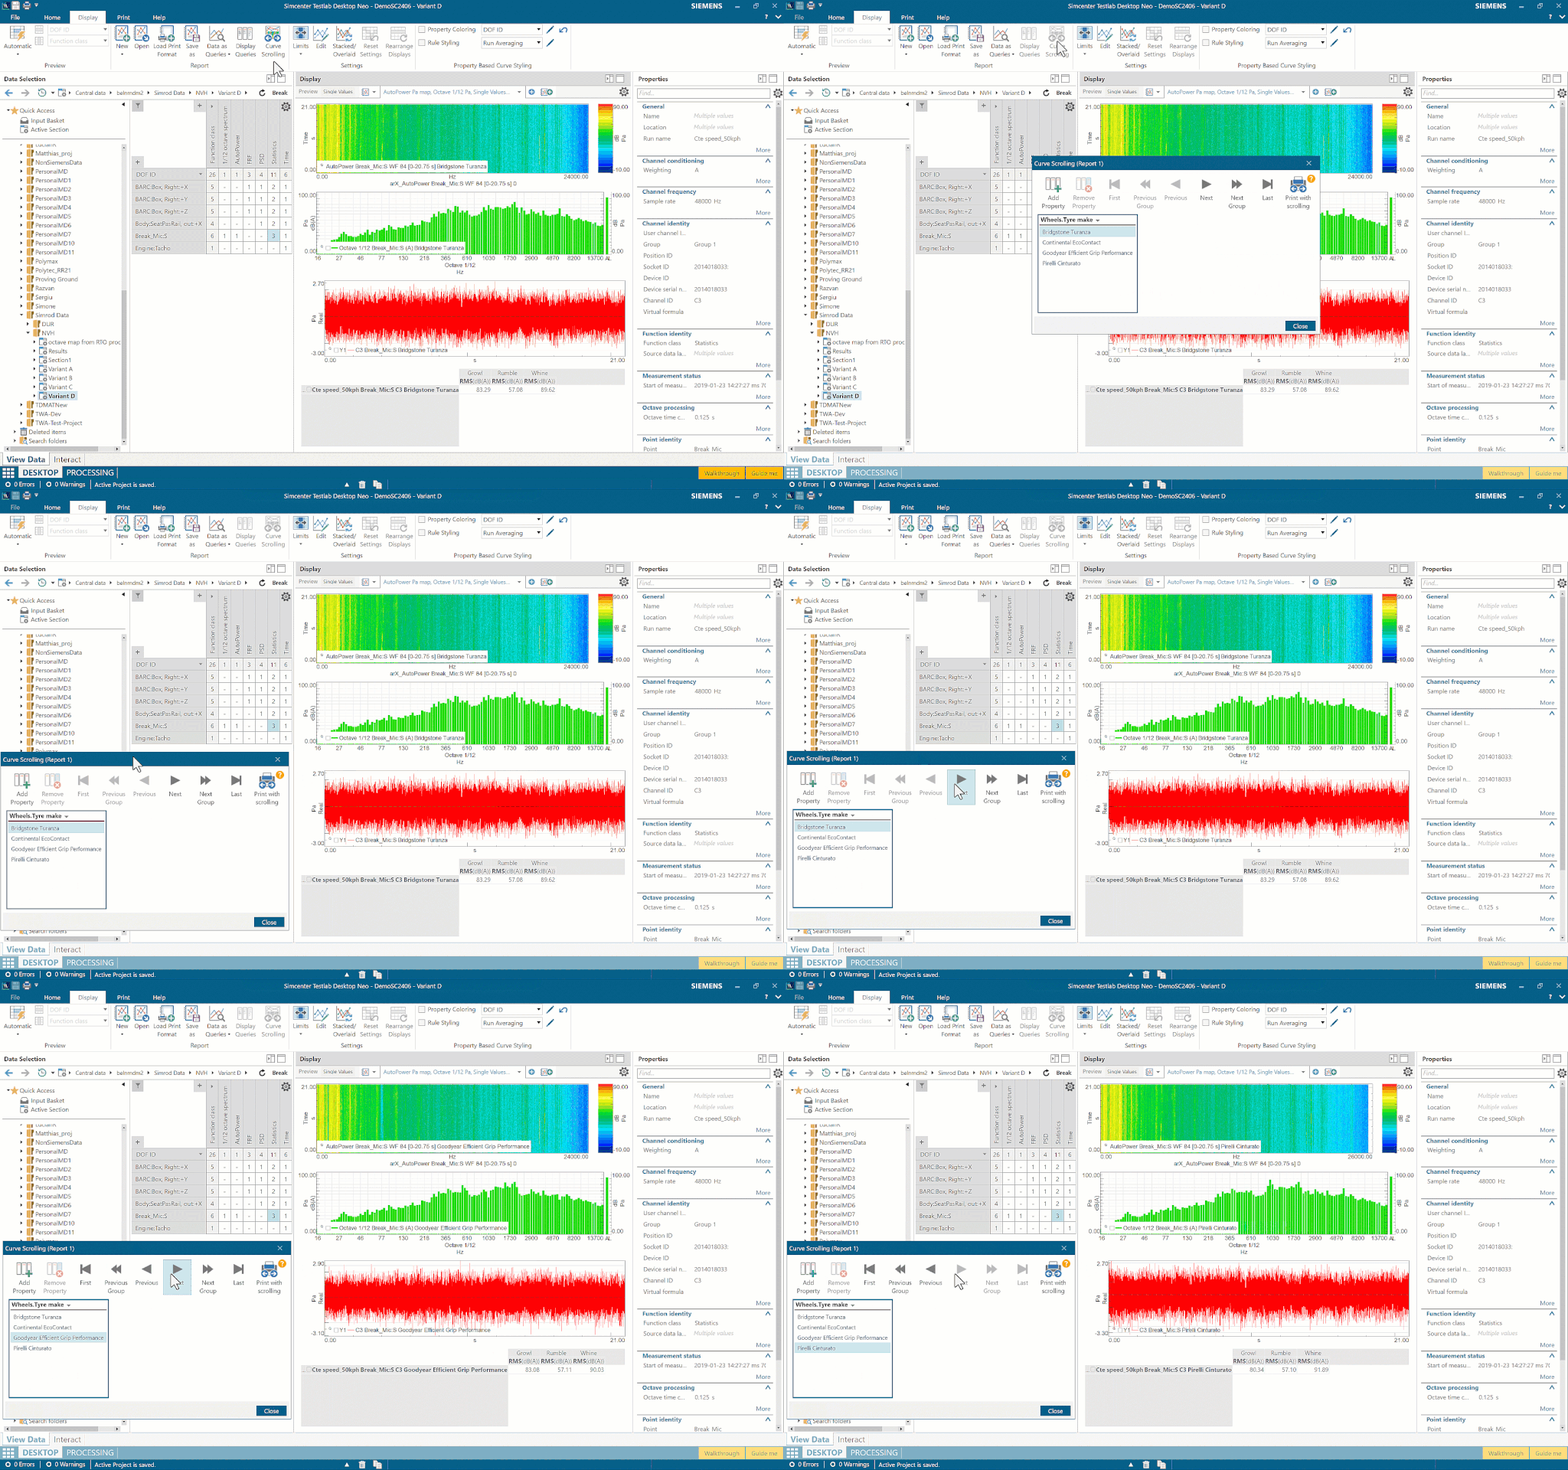
Don’t be fooled by the responsiveness of the application, all of the data that you’re seeing here is stored on the ASAM-ODS server.
Report previewing done; the last step is to generate a Microsoft Office report to share – but actually 95% percent of the job is done. Simply make use of the newly improved Print format assignment (read more about it in Tristan’s blog) and click that Print with Scrolling button.

And here you are, a batch report done on centrally stored data with all your KPIs and annotation included. Beat that, Excel.
Our main goal behind Simcenter Testlab Data Management is enhancing collaboration and democratizing access to data. Learn how you can fully automate your data collection processing and publishing to central storage with the newly released Simcenter Testlab Workflow Automation capability.
Thanks for your time and have fun calculating those KPIs!
