Part 2: Polarion’s R&D Goes DevOps

Part 2: Polarion’s R&D Goes DevOps
by Nick Entin – Software Engineering Director, Polarion ALM, Siemens PLM
In part two of the series, where we continue on how we “drink our champagne” within Polarion R&D and how we utilize Polarion’s capabilities to build Polarion for you!
Let’s kick it off with how we do planning here at Siemens Polarion within Polarion.
Planning
While planning strategically, Capabilities are prioritized and assigned to their corresponding departments. There they are estimated and provided with the relevant Capacities to ensure their completion.
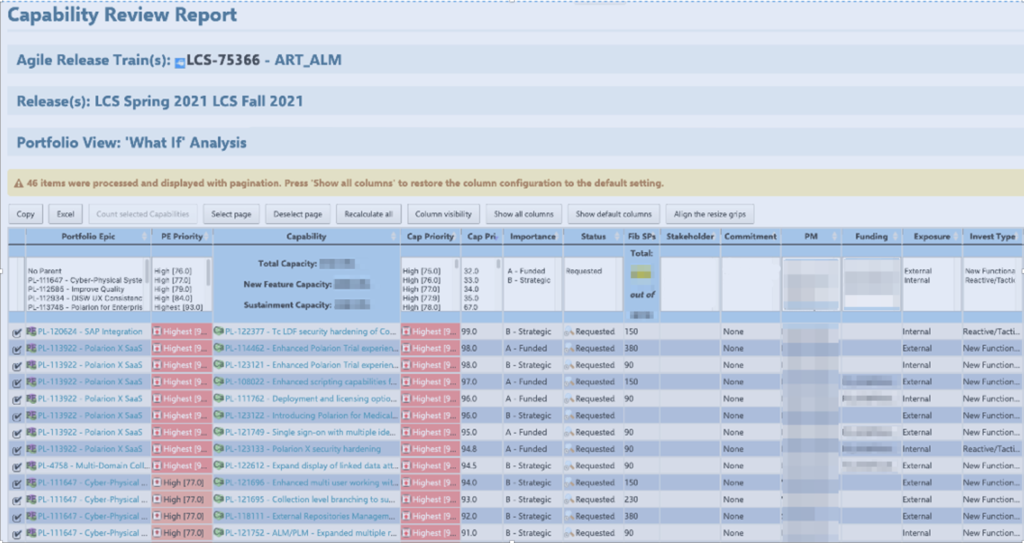
(some pieces of the picture are blurred for business and GDPR reasons)
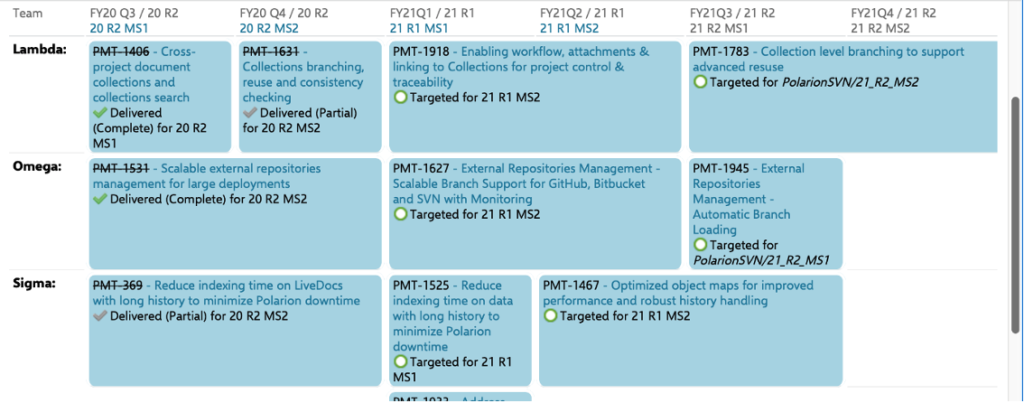
On the product/project level, a plan may be distributed amongst Scrum teams to ensure that the work is distributed appropriately, and any required synchronization is identified.
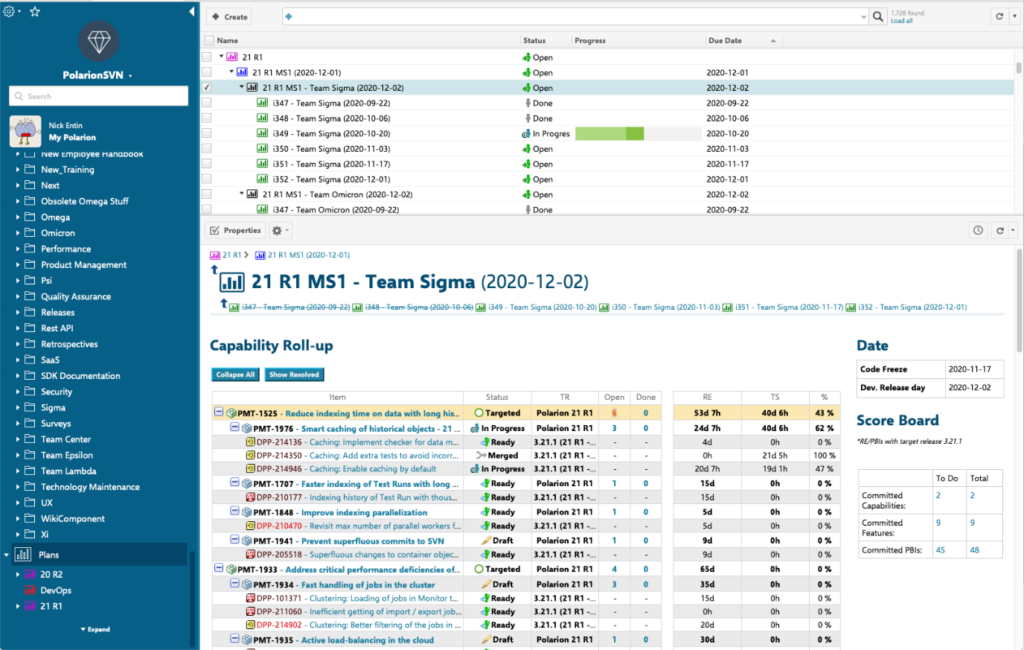
When the planning reaches the Scrum team level, Capabilities are broken down into Features then again into User Stories (Defects, Patches, or other relevant PBIs). On each level, related activities need to be planned, and their progress evaluated over time. For example, a Capability must be aligned with the capacity of the assigned team(s), Features, and planned so that they can be delivered to a customer by the target date. Teams should easily be able to assess a User Story’s level of complexity based on the number of Story Points assigned to it.
Relevant activities for an upcoming PI for a Scrum Team:
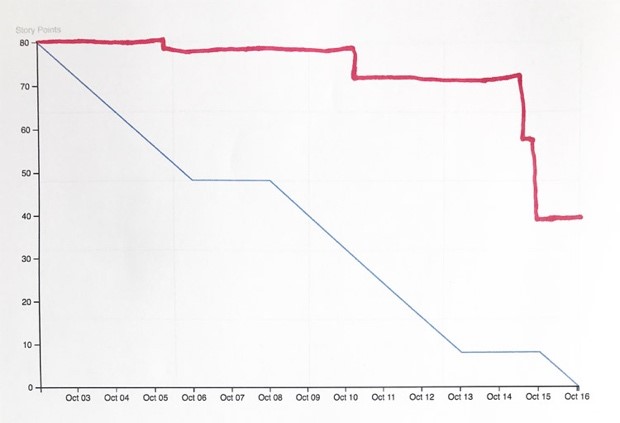
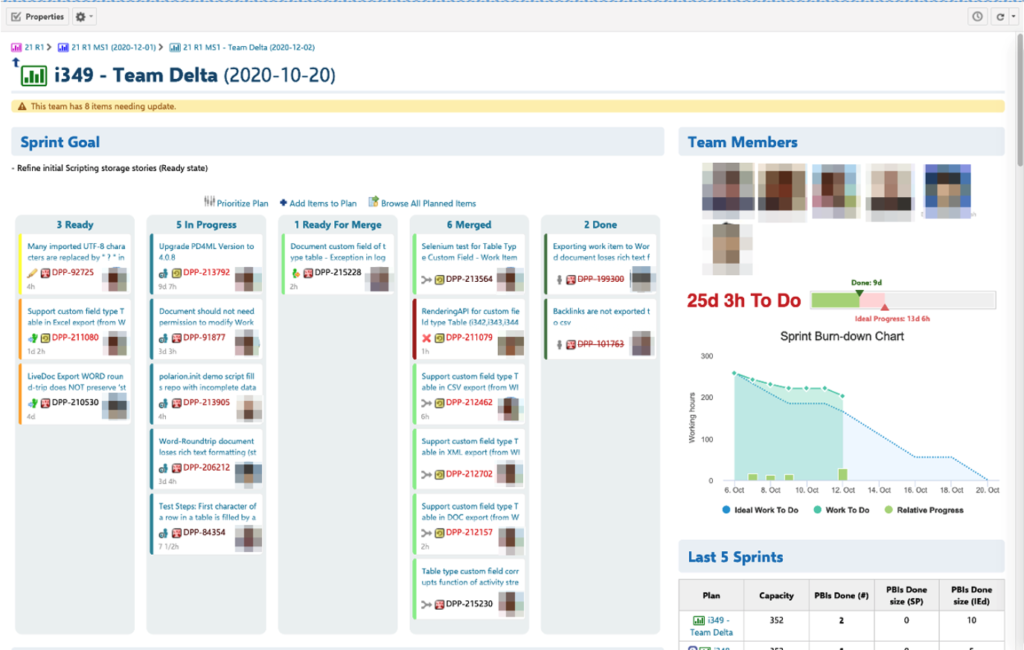
The corresponding execution progress can be monitored via a Burn Down Chart:
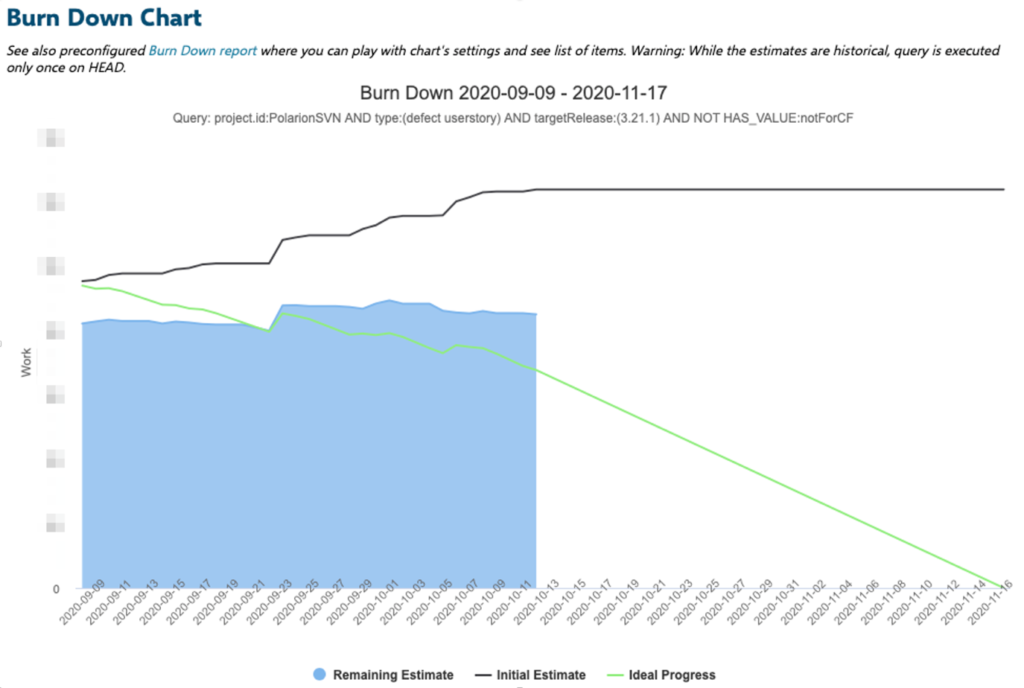
The graph above reflects our level of agility. Even after starting a PI, after all planning and estimations, the estimates continue to change. (And the change is usually a rise.) The gap between the remaining estimate and the ideal progress is expected because we only burn points after the planned PBIs are completely done. (This usually takes a little time before it’s reflected in the Burn Down Chart.)
Possible Burn Down Chart4:
And for a concrete Sprint:
Software Development Lifecycle (SDLC)
I will not touch on all aspects of the SDLC. I am simply trying to give an overall picture of the tool chain we use and how we guide our process through it.
Most of Polarion’s code is written in Java so we use the following Integrated Development Environments (IDE) to code for it: Eclipse, IntelliJ and others.
These IDEs are well integrated with the Revision Control Systems (RCS) we use GitLab and allow for a lot of additional functions like static code analysis or the execution of automated tests directly on newly written code.
1. Source code branching and committing
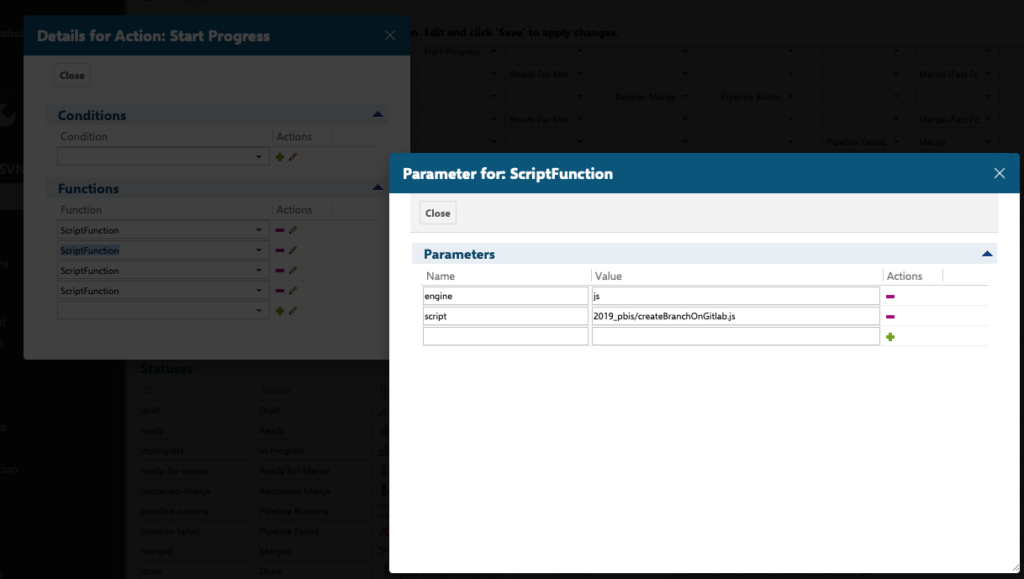
One of our most important best practices is to only make changes to the code base when there’s a compelling reason to do so. These changes are always done via a Project Backlog Increment (PBI). When a User Story or Defect transitions to “In Progress” a GitLab branch is automatically created as part of the workflow.
General PBI lifecycle:
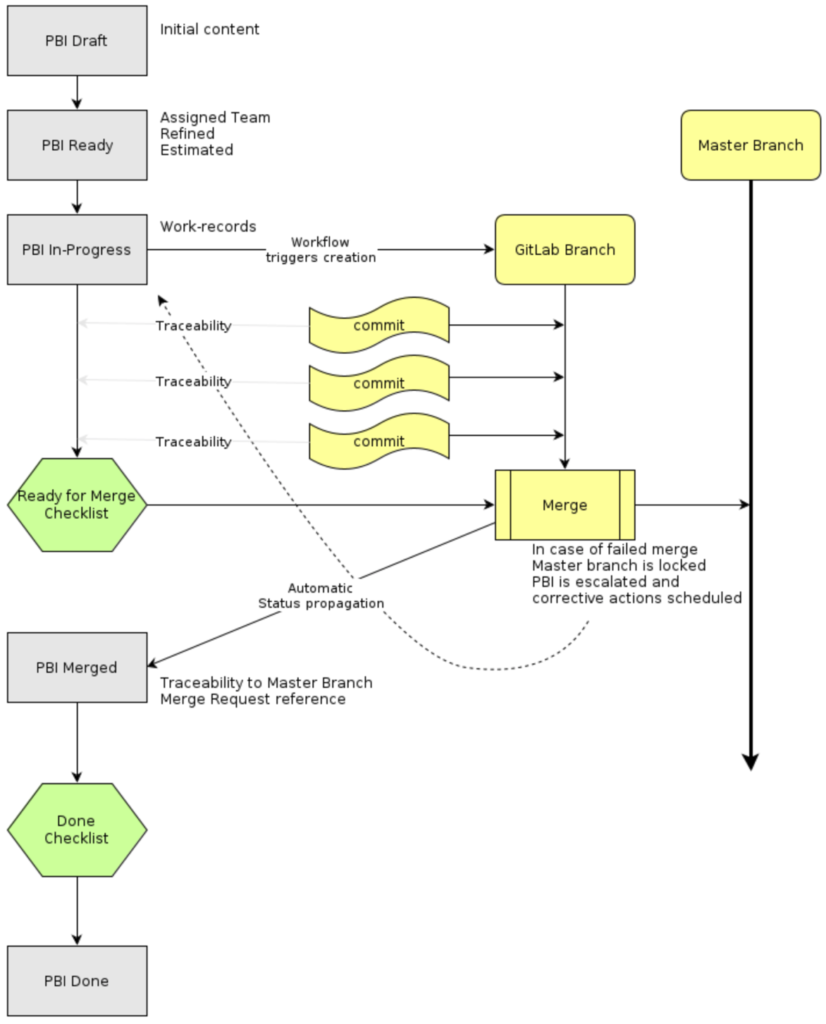
Polarion allows for the automation of these procedures by defining Workflow functions for the corresponding Work Item types:
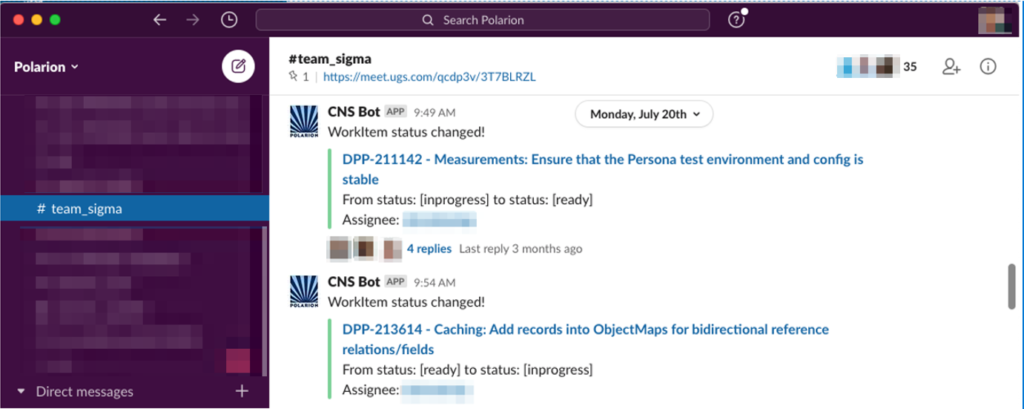
To improve collaboration, we also automatically create Slack notifications so that all Team members are informed of an item’s progress and can discuss issues and obstacles more organically in real-time.
Slack interface:
When a developer is ready to commit changes to a GitLab branch, they include the PBI’s Work Item ID in the Git commit message. (All changes are linked to the item that prompted them.)
The system of IDs works a little differently in Polarion compared to other similar tools. The prefix identifies the project where the Work Item is stored. (“DPP” is our production Project). The second part then assigns a numeric identifier that’s unique to the project.
An example of commits tied to a specific Work Item:
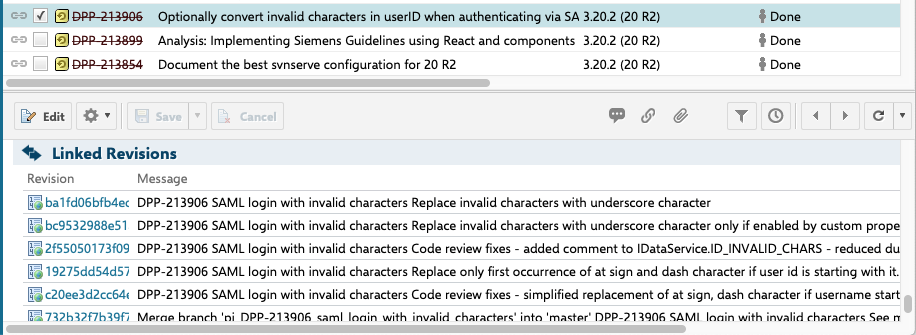
Clicking on the Linked Revision will open the GitLab UI and display the changes made.
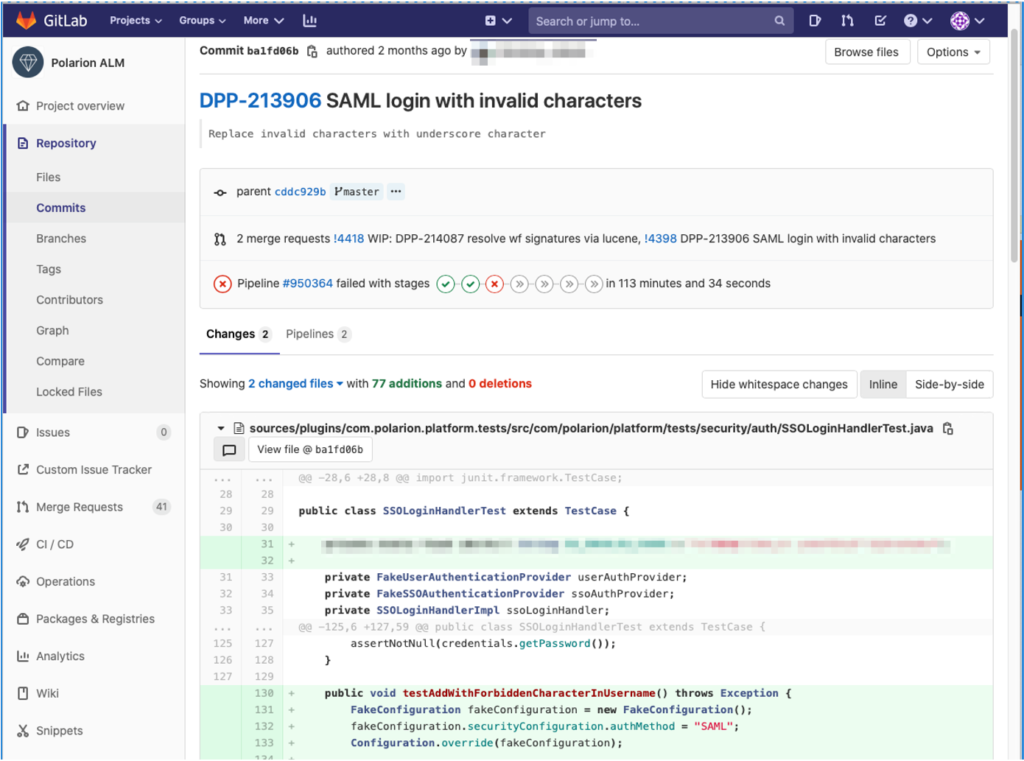
This, together with the review of changes in GitLab, facilitates the Code Review process:
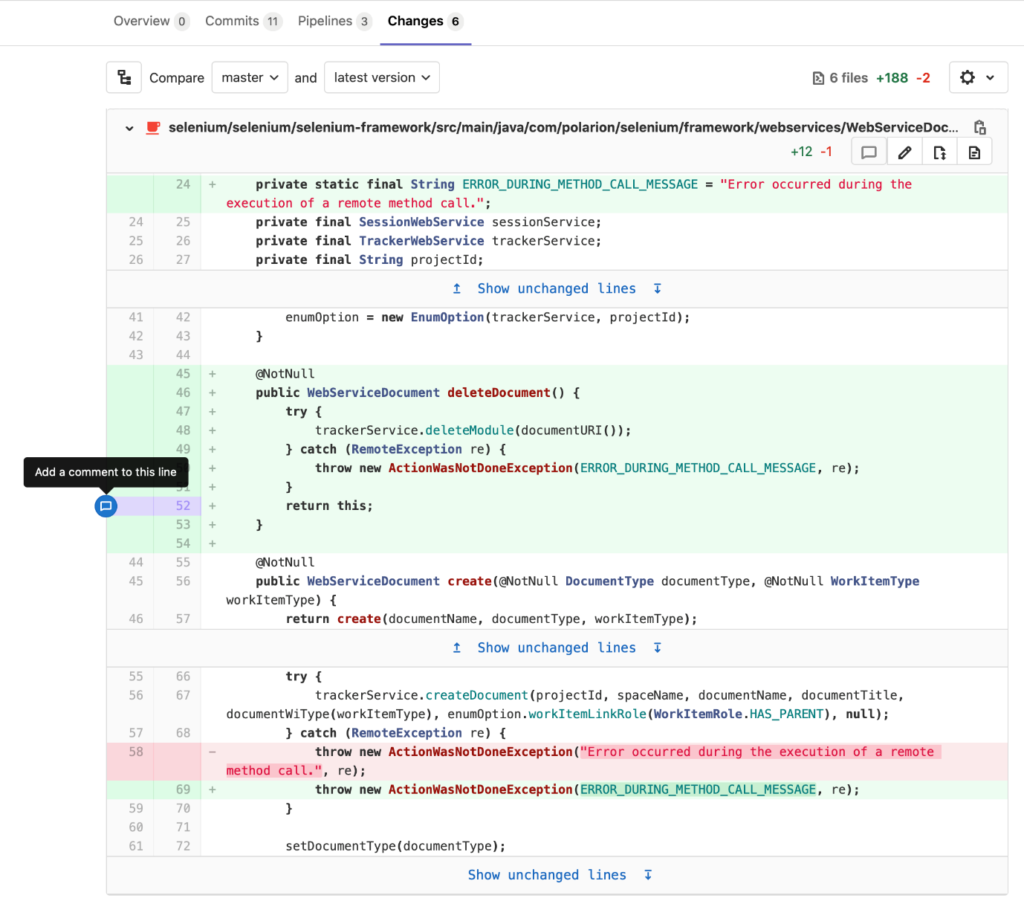
Commenting on a change starts a discussion. All discussions must be resolved before a PBI’s status can be changed to “Ready for Merge”.
The template for the “Ready for Merge Checklist”:
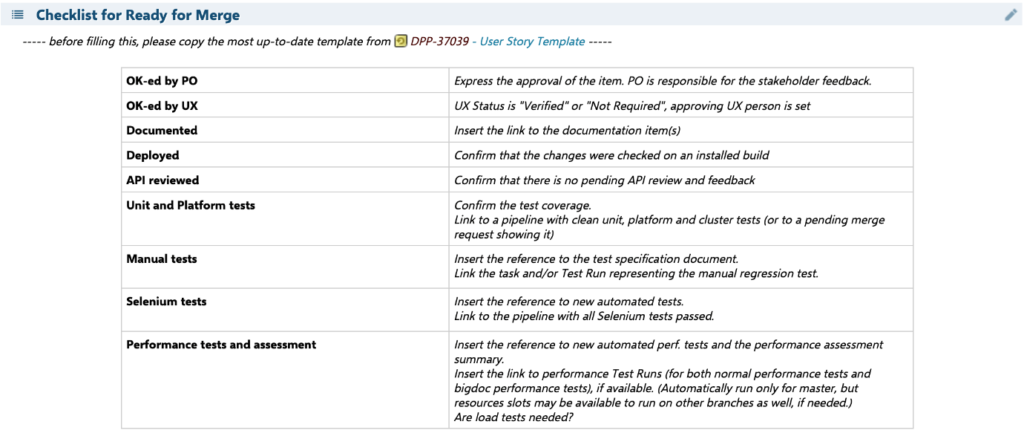
For example, the populated table may look as follows:

Whenever an item is marked as “Ready to Merge”, the responsible engineer can trigger a Merge pipeline. The steps are as follows:
- Integrate the change to the master branch.
- Compile sources and prepare binaries.
- Run unit-tests, API, FOSS and other checks.
- Deploy the binaries to a test environment.
- Run UI-test suits on the environment.
- Run load, stress and performance Tests on a reference environment.
- Collect the results of all Test Runs and report back to Polarion.
- Prepare a shippable package.
You can see the pipeline execution status in GitLab:
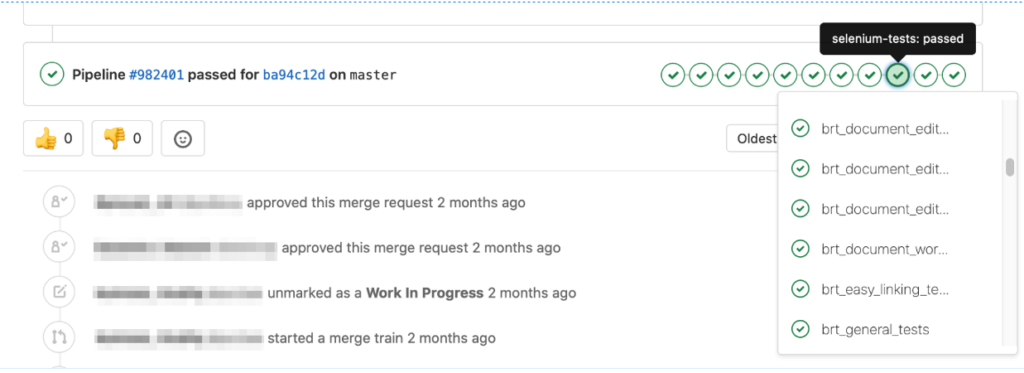
The merge request is expected to be successful. Before it gets added to the Master, the team must run the same compilation, unit, and UI tests on both their local branches and Team servers.
One aspect that requires special attention is performance tests. They are executed on a reference environment that often differs from the development environment. As a result, performance tests that succeed on the local branch may fail on the Master.
What we do when this happens:
Before a PBI can be closed, we confirm that there are no regressions and make sure that the pipeline’s performance tests pass. If any suspects are identified, we lock the Master branch and no new commits are allowed until the situation is clarified. (Identify if it’s a temporary outage, a side effect of something on the test server, or a genuine regression). The team that created the suspicious merge request makes it their top priority to address the problem, even if it means rolling back the commit. Only then is the Master branch unlocked and further commits allowed.
Pipeline types that facilitate the different product-life-cycle phases:
- Master = Runs on every push to the Master. Runs all tests, all distributions, all installers and all dockers.
- Release = Runs when any tag is created. Runs all tests, all distributions, all installers, all dockers and packages the release.
- Post-release = Runs on every push to the Release branch. Runs unit and platform tests, all distributions, all installers and all dockers.
- PI Merge Request = Runs on every push to a PI branch with an open merge request, runs consolidated stage which is the same as consolidated custom pipeline, but each job is executed only if there are relevant changes
- Custom – Teams can create pipelines on-demand with custom parameters.
After a successful merge to the Master, but before the PBI is set to “Done”, the following checklist must be filled out in the User Story:

Here’s an example of a completed checklist:

2. Continuous deployment (CD)
Whenever a commit happens on a branch, the CD is configured to grab the results and deploy them to a server for debugging, testing, reference implementation, or what’s most common in our case, to deploy the Master branch results to an internal production environment. This helps us complete the first level of testing in a practical environment before customers see it. We’ve been doing this “dogfooding”5 at Polarion from the start.
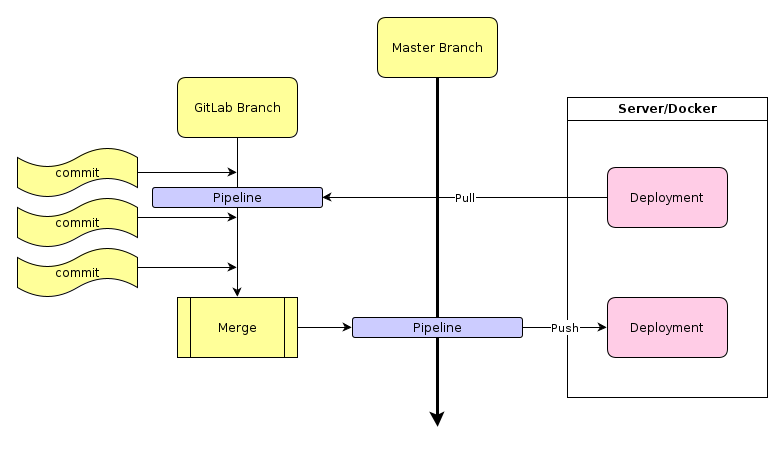
While a continuous deployment of the Master branch is always desired (its pipeline ends with 100% positive results), local branches may depend on the status of the development cycle. For example, a team may wish to have a solution running and testable after each commit, so they configure one of the local pipelines to compile and immediately deploy to a team server. They may instead opt for a daily deployment model where the sever pulls the last available results overnight and deploys it for use the following day.
They can always start a pipeline manually or request a new deployment via a command-line script. (Even to a different server or a container.)
3. Traceability and impact analyze
Polarion offers an easy way to check the impact and traceability information on how, for example, a Capability is really implemented and/or tested:
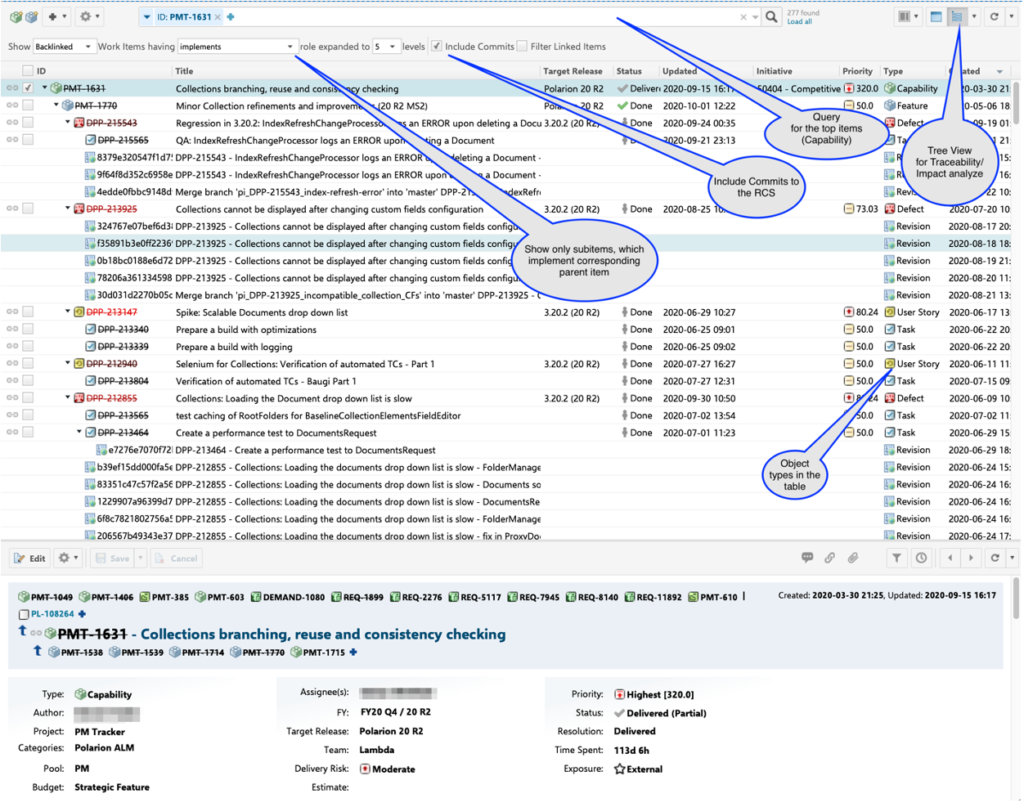
Still want to hear more?
That wraps it up for this blog series about Polarion R&D goes DevOps. If you have questions on anything else, we’d love to hear from you. Simply contact us and we’ll be in touch. Do you need help and advice on how to apply something similar in your own environment – approach Siemens Services, they will be happy to help.

Nick Entin
Software Engineering Director, Polarion ALM, Siemens PLM
Do you have ideas or are willing to share your experience – go to Polarion’s Community site: www.polarion.com/community
Comments
Leave a Reply
You must be logged in to post a comment.
Hi,
thanks a lot for the article.
It looks like we’re planning to introduce a similar workflow for our team.
Is it possible to get your javascripts or some kind of template to get started with integrating GitLab to Polarion?
Best regards,
Pascal