IC designers: find your focus and priorities during DRC debug
By Srinivas Velivala – Mentor, A Siemens Business
Layout design verification gets exponentially harder with each new process technology node. Here we discuss the three stages of DRC verification to improve efficiency and production
The increasing number and complexity of design rule checks (DRC) increases both DRC runtime and the results debugging cycle time, which makes it harder to meet your tapeout schedules. Custom, analog/mixed-signal (AMS) and digital designers can offset some of this time by using signoff DRC tools in the design environment to get immediate DRC feedback on layouts. However, if you’re not setting up and running that signoff DRC job correctly, you may be losing any benefit you hope to gain.
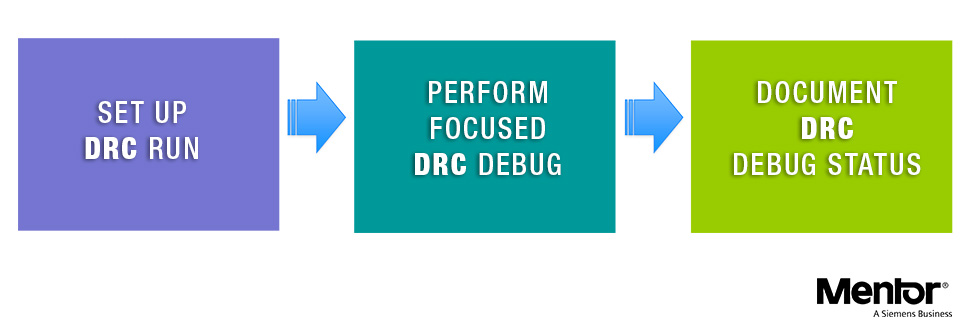
To be efficient and productive, you need to optimize the three stages of the DRC verification and debug process: setting up the DRC run, performing focused DRC debugging, and documenting the DRC debug status.
Designers set up the DRC run by specifying DRC rule deck switches and options that are relevant to the type of design on which the DRC job is being launched, such as cells, blocks and full-chip. Adding custom rule categorizations and check recipes (check groups) to your setup enables expanded classification and sorting of DRC results. Using a single signoff verification process with the same look and feel, and the same use model across various design environments, lets you launch signoff physical/circuit verification jobs with a push-button flow. That way, you can spend your time optimizing designs, rather than worrying about the setup for verification jobs.
This additional categorization of DRC results lets you focus on fixing high priority results first, making your debug both efficient and effective. Another aspect of debugging is the display of DRC results. Adopting a solution that can dynamically and automatically change the displayed design layers, based on the DRC rule to which the result belongs, lets you focus on the actual DRC debugging, not deciding which layers to turn off and on.
Of course, once you’re done debugging, you need to document the results and share it with other interested parties. Instead of manually creating this documentation, doesn’t it make more sense to use a tool that can automatically generate all the required information for you?

The Calibre® Interactive™ and Calibre RVE™ tools help designers specify DRC options in a simple, maintainable, and reproducible setup, categorize and prioritize DRC results, perform focused DRC debug, and automatically generate status reports in a repeatable fashion. The results categories, filters, and improved visualization of results in the design environment not only improve designers’ DRC debug productivity, but also allow them to focus on design-critical tasks that further optimize their designs. Using such tools can help you improve your debugging results and optimize your designs while still meeting tight tapeout and delivery schedules.
To learn more, download our white paper – Making DRC debug more focused and effective improves designer productivity