Part 12: The 2016 Wilson Research Group Functional Verification Study
ASIC/IC Verification Results
This blog is a continuation of a series of blogs related to the 2016 Wilson Research Group Functional Verification Study (click here). In my previous blog (click here), I provided data related to designs that actively manage power. In this blog, I present verification results findings in terms of schedules, number of required spins, and classification of functional bugs.
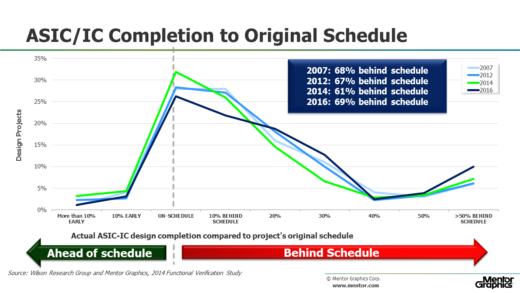
Figure 1. Design Completion Compared to Original Schedule
Figure 1 presents the design completion time compared to the project’s original schedule. While the data suggest that in 2014 there might have been a slight improvement in projects meeting their original schedule, the 2016 findings are consistent with the 2007 and 2012 studies. The bottom line is that meeting the originally planned schedule is still a challenge for most of the industry.
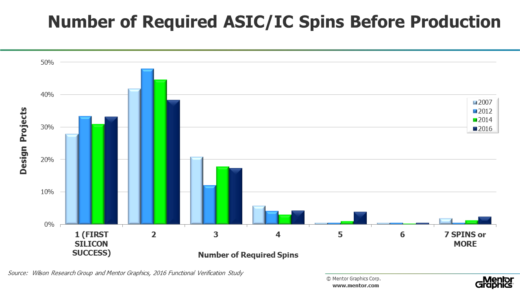
Figure 2. Required Number of Spins
Other results trends worth examining relate to the number of spins required between the start of a project and final production. Figure 2 shows this industry trend from 2012 through 2016. Even though designs have increased in complexity, the data suggest that achieving first silicon success is not getting any worse in terms of the number of required spins before production. Still, only a little more than 30 percent of today’s projects are able to achieve first silicon success. In addition, it is worth noting that achieving second silicon success is getting worse.
Figure 3 shows various categories of flaws that are contributing to respins. Again, you might note that the sum is greater than 100 percent on this graph, which is because multiple flaws can trigger a respin.
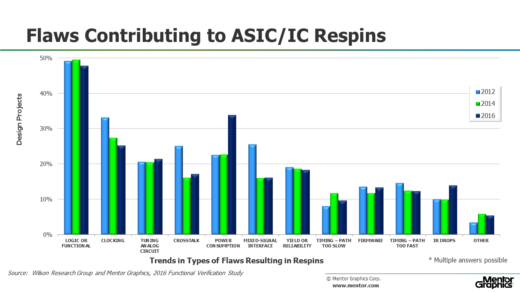
Figure 3. Types of Flaws Resulting in Respins
Logic and functional flaws remain the leading causes of respins. One observation from the 2016 study is that there seems to have been a spike in the number of respins due to power issues.
Figure 4 examines the root cause of logical or functional flaws (previously identified in Figure 3) by various categories. The data suggest design errors are the leading cause of functional flaws, and the situation is worsening. In addition, problems associated with changing, incorrect, and incomplete specifications are a common theme often voiced by many verification engineers and project managers.
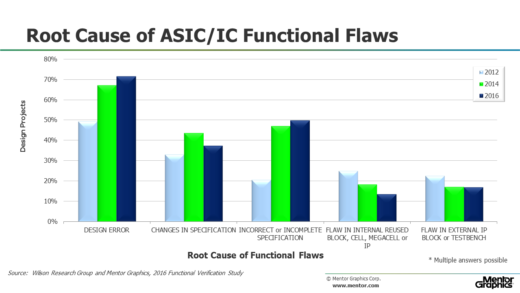
Figure 4. Root Cause of Functional Flaws
In my next blog (click here), I provide some concluding remarks and observations.
Quick links to the 2016 Wilson Research Group Study results
- Prologue: The 2016 Wilson Research Group Functional Verification Study
- Understanding and Minimizing Study Bias (2016 Study)
- Part 1 – FPGA Design Trends
- Part 2 – FPGA Verification Effort Trends
- Part 3 – FPGA Verification Effort Trends (Continued)
- Part 4 – FPGA Verification Effectiveness Trends
- Part 5 – FPGA Verification Technology Adoption Trends
- Part 6 – FPGA Verification Language and Library Adoption Trends
- Part 7 – ASIC/IC Design Trends
- Part 8 – ASIC/IC Resource Trends
- Part 9 – ASIC/IC Verification Technology Adoption Trends
- Part 10 – ASIC/IC Language and Library Adoption Trends
- Part 11 – ASIC/IC Power Management Trends
- Part 12 – ASIC/IC Verification Results Trends
- Conclusion: The 2016 Wilson Research Group Functional Verification Study


Comments